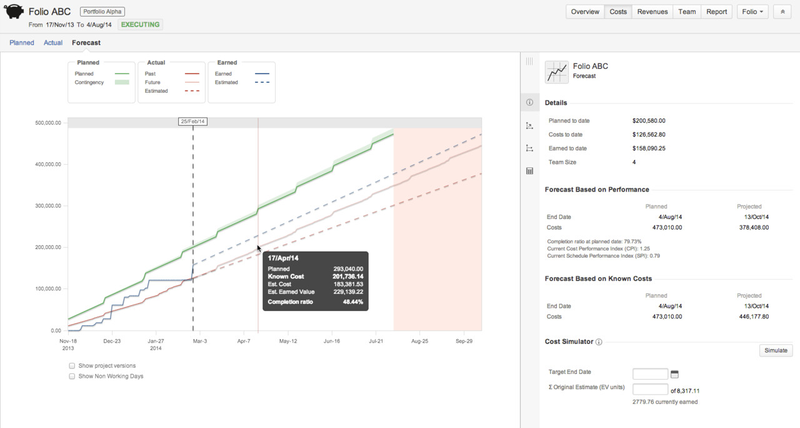
The forecast chart displays various curves showing the evolution of financial numbers related to the current Folio or Portfolio. It spans on a period of time that covers the whole time frame of the Folio, plus possibly a "Behind Schedule" period. The "Behind Schedule" period (pale red area at the extreme right of the chart) appears if the current performance indices of the Folio lead to an estimated end date later than the current configured end date of the Folio. Note that in the case of a Folio without EVM, if it is configured to determine the completion ratio based on the project calendar progress, then the Folio will never be considered ahead or behind schedule. Today's date is indicated by a vertical dashed line. Clicking on any series of the chart brings up a tooltip that displays the detailed information at the selected point in time.
Areas
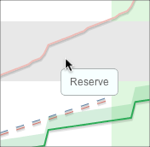
The chart may display various coloured areas, depending on the Folio's configuration or current performance indices. These are described below.
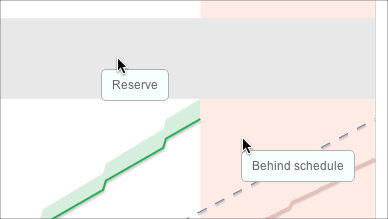
Reserve
The Reserve is an area sitting on top of total Planned Value and reflects the reserve percentage configured for the current Folio.
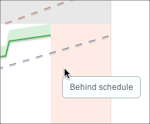
Behind schedule
The Behind schedule area appears if the current Schedule Performance Index of the Folio leads to an estimated completion date that is later than the Folio's planned end date. When displayed, the area sits at the extreme right of the chart, starting at the Folio's planned end date. Note that in the case of a Folio without EVM, if it is configured to determine the completion ratio based on the project calendar progress, then the Folio will never be considered behind schedule.
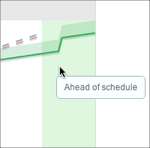
Ahead of schedule
The Ahead of schedule area appears if the current Schedule Performance Index of the Folio leads to an estimated completion date that is earlier than the Folio's planned end date. When displayed, the area sits at the extreme right of the chart, starting at the Folio's planned end date. Note that in the case of a Folio without EVM, if it is configured to determine the completion ratio based on the project calendar progress , then the Folio will never be considered ahead of schedule.
Point Selection Details
Clicking on a curve of the chart brings up a tooltip containing precise values at that particular point in time.
| Tip |
|---|
When a point is selected, you can navigate to the next data point by typing j or to the previous one by typing k. |
| Point selected is today or before | Point selected is in the future |
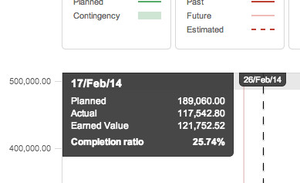 | 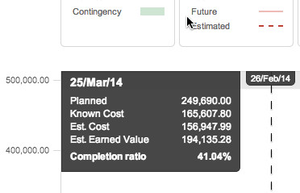 |
| Planned | Planned Value at the selected point in time. |
|---|
| Actual | Actual Value (Cost or Revenue) a at the selected point in time. |
|---|
Earned Value | [EVM only] Earned Value at the selected point in time. |
|---|
| Known Cost (or Known Revenue) | Known Cost (or Revenue) a at the selected point in time. |
|---|
| Est. Cost (or Est. Revenue) | Extrapolated Estimated Cost (or Revenue) at the selected point in time given current performance. |
|---|
| Est. Earned Value | [EVM only] Extrapolated Earned Value at the selected point in time given current performance. |
|---|
| Completion ratio | Actual (or estimated if selection is in the future) completion percentage of the project at a specific point in time. |
|---|
Show / Hide Non-Working Days
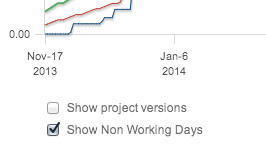
The Show Non Working Days option allows you to display weekend days and other configured non working days on the chart.
Show / Hide Project(s) Versions
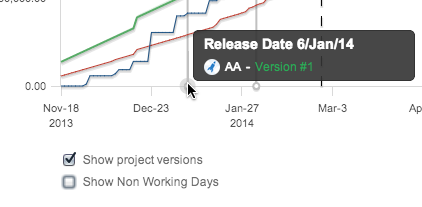
The Show Project Versions option allows you to display the project Versions you defined in JIRA. All versions from all projects included in the Folio's scope will be shown when the option is selected.
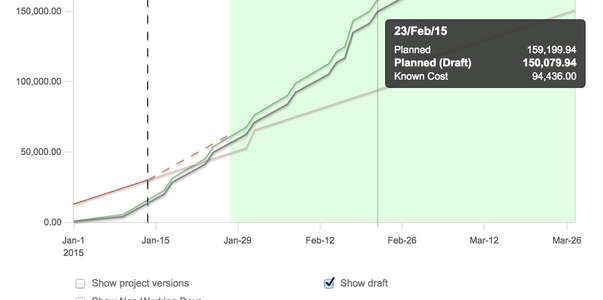
Show / Hide Draft
If the budget have been approved at least once, then you can choose to show the current budget draft on the forecast chart. The budget draft contains the latest version of unapproved changes to expenses and positions (under the Planned sub-tab).
To display the current budget draft, check the Show Draft box located under the chart. Hide the budget draft by unchecking the box. The budget draft is displayed as a gray curve and its daily value can be viewed in the chart's tooltip by hovering or clicking any point on one of the curves.
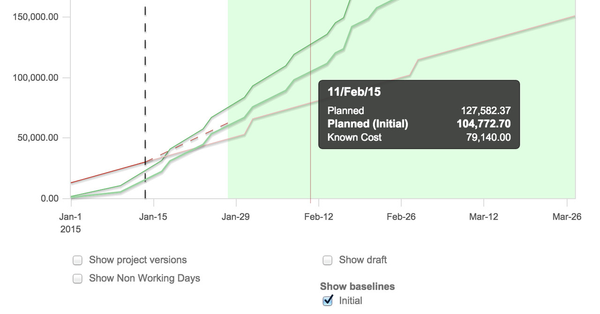
Show / Hide Previous Baselines
If the budget have been approved more than once, then you can choose to show one or more previous budget baselines on forecast chart.
To display a previous baseline, check the corresponding box located under the chart, under the Show baselines. You can select many baselines to display them simultaneously. Hide a baseline by unchecking it. Baselines are displayed as a green curves and their daily value can be viewed in the chart's tooltip by hovering or clicking any point on one of the curves.
Forecast details
The Forecast details panel appears on the righthand side of the Forecast screen. It displays other financial details of interest.
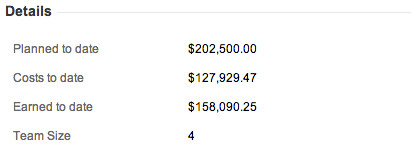
Details
This section displays the Planned Value, Actual Value (Cost or Revenue) and Earned Value to date (if EVM is used). Is also shows the current team size (the number of assigned positions as of today).
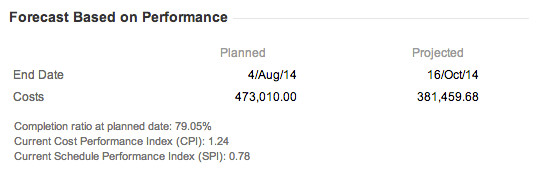
This section shows projections based on the past performance. It shows a comparison between planned and projected end dates as well as planned and projected total costs. When using EVM, performance is determined by indices, namely the Cost Performance Index (CPI) and Schedule Performance Index (SPI). When not using EVM, the performance is based on the current completion ratio and actual costs or revenues to date.
The Completion ratio at planned date gives the estimated completion percentage at the planned end date based on the current trend (CPI).
The Current Cost Performance Index (CPI) gives the value of the CPI used to estimate the projected cost.
The Current Schedule Performance Index (SPI) gives the value of the SPI used to estimate the projected end date.
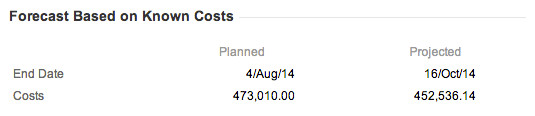
Forecast based on future known costs
This section shows projections based on future known costs (or revenues). It shows a comparison between planned and projected end dates as well as planned and projected total costs (or revenues) based on future known costs (or revenues) .
| Anchor |
|---|
| CostSimulator |
|---|
| CostSimulator |
|---|
|
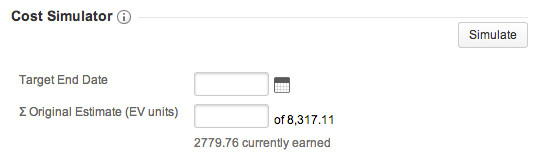
Cost Simulator
[Available for Costs only] The Cost Simulator allows you to perform some simulations in order to get estimates, for instance, on the team size that would be required to attain a certain Earned Value.