Understanding the diagram
Diagram elementsThe diagram is made of nodes and directed edges between these nodes. This section gives details about the elements found in the diagram. NodesThe nodes in a diagram represent any type of JIRA issues (epics, stories, tasks, bugs, etc.). Nodes are drawn as blue rectangles by default. Their color changes depending on user action's. 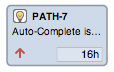 A node displays basic information about the issue, namely
Hovering a node with the mouse pointer brings up a tooltip giving more detailed information about the issue.  The tooltip displays the following information:
Nodes positioningThe nodes in the diagram are positioned using a force-directed graph layout algorithm. This algorithm uses physics rules to place nodes in a way that tries to minimize node overlapping and edge crossing. Of course, the selected issues might not all be connected. Furthermore, some of these issues might be connected to no other of the displayed issues. The latter are called orphans. So in order to make the diagram clearer, the force-directed layout used in Pathfinder is adapted to make nodes attracted to different places on the canvas. Nodes are placed using the following rules:
The automated graph layout complexity Graph layout is notably a complex problem and no layout algorithm will yield perfect results in every case. The readability of the rendered graph will depend on many factors, such as the number of nodes displayed, the number of nodes in a specific group of nodes, the presence of cycles in connected groups, etc. Pathfinder offers you many options to help you view your issues better, such as hiding orphans, limiting the nodes displayed by specifying what issues to discover, moving nodes around, zooming and panning, etc. EdgesEdges connect two nodes together and represent the links between JIRA issues. The edges of the diagram are directed, meaning they go from a source node to a target node. For example, if the context of a link of type 'Blocks', an edge from node ABC-1 to node ABC-3 would mean that Issue "ABC-1 blocks issue ABC-3". The type of links being displayed in the diagram is indicated by the Link type selected in the parameters panel on the right.
|