This is the documentation for an older version of Folio and has been moved to the Tempo instance.
Please view the Folio Category in the Tempo Products Wiki Categories for all versions of Folio's Documentation.

Portfolio Overview


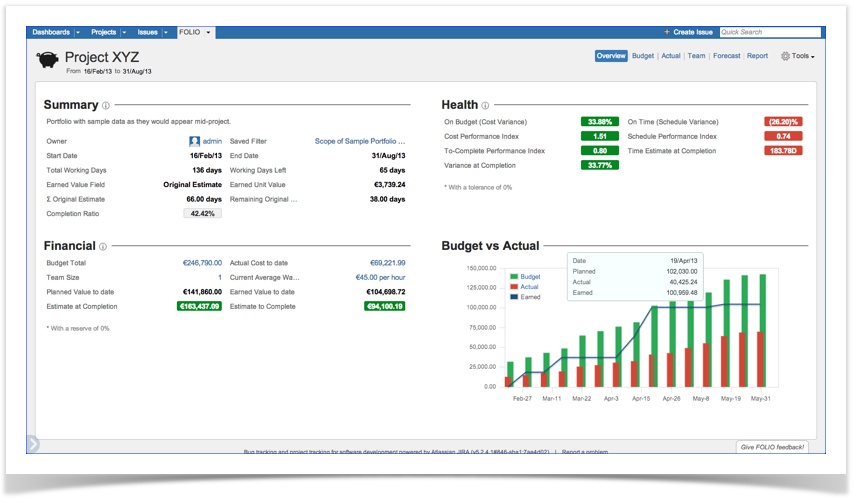
The overview page allows you to see the current status of your portfolio at a glance.
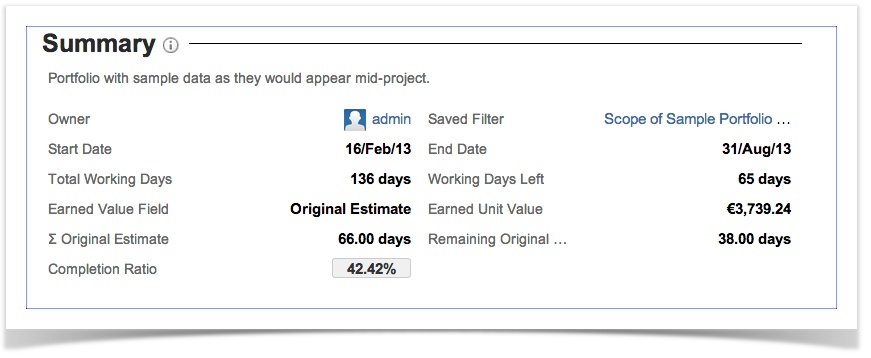
 

Summary 

The following table describes the various fields of the summary section.
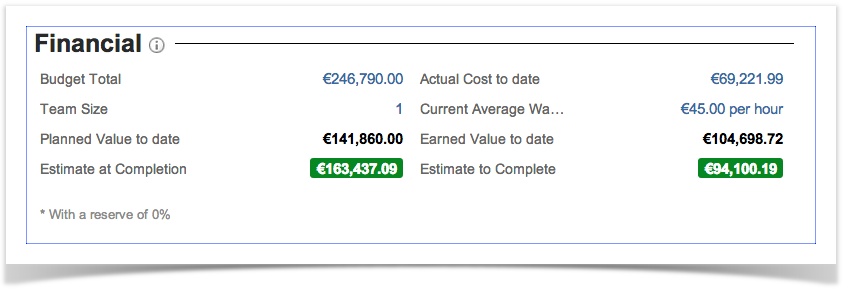
 

Clicking on information icon will show you online definitions of elements displayed in the summary section

Note that clicking on losanges or on values such as "Working Days Left" will display the clicked item definition.

Owner

Current portfolio owner.

Notes :

    • Clicking on owner field will bring you on owner's JIRA User information.
    • Bring your mouse over the owner name; an inline dialog box will offer you more information.

Saved filter

JIRA Issue Filter use to define the portfolio scope.

Note that clicking on the saved filter field will bring you to the saved filter definition.

Start Date

This is the date from which you want to start reporting expenses and positions in a portfolio.

End Date

This is the date the portfolio ends. This is a critical date since it gives the pace of progress the team
should maintain to successfully complete the portfolio scope.

Total Working DaysTotal number of days between the start and end date of the portfolio.
The working days are computed based on the JIRA Time Tracking 'days per week'
setting and the non working days defined in the portfolio's configuration.
Working Days Left

Number of working days left until the planned completion date.

Earned Value FieldEarned value (EV) offers better progress measurement. When earned value is used, you only get credit for work done when a task is complete.
Each task is assigned a percent value, so that all of the project tasks total one hundred percent.

Earned Unit Value

Earned Unit Value roughly indicates the cost of a single earned value unit.
It is computed by simply dividing the Budget at Completion (BAC) by the total Earned Value of the project.
Σ Selected Earned Field Indicates the total sum of Selected Earned Field of the portfolio.
It is computed based on the issues that are part of the project's scope defined by the saved filter.
Remaining Selected Earned Field Indicates the remaining sum of Selected Earned Field  of the portfolio to date. 
It is computed based on the issues that are not yet completed following the Earning rule defined in the portfolio's configuration.
Completion RatioThe completion ratio indicates how much Earned values (defining earned value) were completed vs the project's total. 
It is computed by dividing the completed Earned values to date by the total Earned values at completion.

Clicking on information icon will show you online definitions of elements displayed in summary section

Note: clicking on losanges or on values such as "Working Days Left" will display the clicked item definition.


Financial


The following table describes the various fields of the financial section.
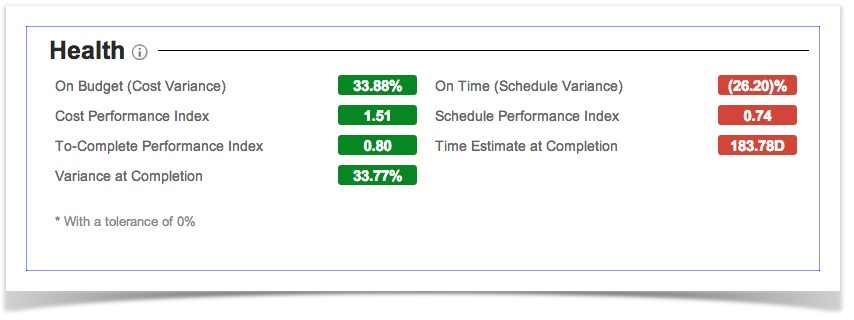
 

Clicking on information icon will show you online definitions of elements displayed in financial section.

Note that clicking on losanges or on values such as "Earned Value to date" left will display the clicked item definition.

Budget Total

Total planned budget for the current portfolio.

Note that clicking on budget amount will bring you to the Portfolio Budget page.

Actual cost to date

Actual cost up to now.

Note that clicking on actual amount will bring you to the Portfolio Actual    page.

Team Size

Number of members of the current portfolio team.

Note that clicking on Team size number will bring you to the Portfolio Team page.

Current Average Wage

Current average team member wage.

Note that clicking on Team size number will bring you to the Portfolio Team page.

Planned Value to date

Indicates the Budgeted value that should have been completed to date.

Earned Value to dateIndicates the Earned value that have been completed to date. 
It is computed by multiplying the Completion ratio to date by the Budget at Completion of the portfolio.
Estimate at CompletionThe Estimate at Completion (EAC) is the estimated cost of the project at the end of the project.
It is the highest value between the Future Known Cost at Completion and the computed value from
the division between the Planned Value at Completion and the Cost Performance Index (CPI).
Estimate to Complete

The Estimate to Complete (ETC) is the estimated cost required to complete the remainder of the project.
It is the highest value between the Future Known Cost to Completion and the computed value from
the subtraction of the Earned Value from the Planned value at completion divided by the Cost Performance Index (CPI).


Health

The following table describes the various fields of the health section.
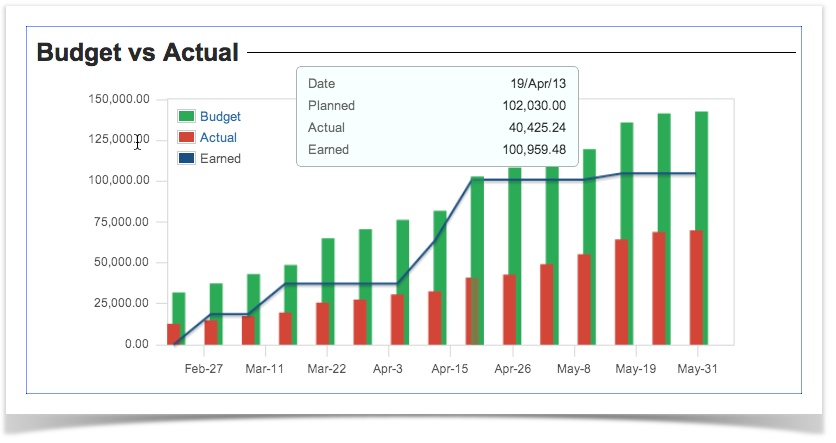
 

Clicking on information icon will show you online definitions of elements displayed in the health section

Note that clicking on losanges will display the clicked item definition.

On Budget (Cost Variance)This index (CV) determines if the project is under or over the budget. 
It is computed by subtracting the Actual Cost from the Earned Value divided by the Earned Value. 
A negative value indicates that the project is over budget.

On Time (Schedule Variance)

This index (SV) determines whether the project is ahead of or behind schedule. 
It is computed by subtracting the Planned Value to date from the Earned Value divided by the Planned Value to date. 
A negative value indicates that the project is behind schedule.
Cost Performance IndexThis index (CPI) determines how efficiently the team is using its resources.
It is computed by dividing the Earned Value by the Actual Cost.
A value lower than one indicates a loss of efficiency.

Schedule Performance Index

This index (SPI) determines how efficiently the project team is using its time. 
It is computed by dividing the Earned Value by the Planned Value to date. 
A value lower than one indicates a loss of efficiency.
To-Complete Performance IndexThis index (TCPI) determines the efficiency that must be achieved on the remaining work for a project to meet the Budget at Completion.
It is computed by dividing the work remaining (BAC - EV to date) by the budget remaining (BAC - AC to date).

A value greater than one indicates that the performance must improve.
Time Estimate at CompletionThis index (EACt) determines a rough estimate in working days of when the project will be completed, 
if current trends continue. It is computed by dividing the remaining days by the Schedule Performance Index (SPI).
Variance at CompletionThis index (VAC) determines whether the project will finish under or over budget. 
It is computed by subtracting the Estimate at Completion from the Budget at Completion divided by the Budget at Completion. 
A negative value indicates how much more resources will need to be injected to achieve the project goal.


Budget vs Actual

The Budget vs Actual bar chart show the portfolio weekly statuses up to date. When Clicking on bars or line you get the Planned, Actual and Earned values as they were at the end of the selected week.

Note that clicking on Budget or Actual on the chart legend will bring you to the Portfolio Budget or Portfolio Actual page


Definitions

AcronymDefinitionDescription
PVPlanned ValuePlanned Value at a given point in time.
ACActual CostKnown cost of work performed at a given point in time.
EVEarned ValueMeasure of work performed at a given point in time.
BACBudget At CompletionTotal Budget estimated.
Indices
CPICost Performance Index

Determines how efficiently the team is using its resources

EV / AC

    • Favorable if over 1.0.
    • Unfavorable if under 1.0. 


SPISchedule Performance Index

Determines how efficiently the project team is using its time

EV / PV

    • Favorable if over 1.0.
    • Unfavorable if under 1.0.


TCPITo-Complete Performance Index

Determines the efficiency that must be achieved on the remaining
work for a project to meet the Budget at Completion

 (BAC - EV) / (BAC - AC) 


Variances
CVCost Variance

Determines if the project is over or under budget

EV - AV

    • Under budget if over 0.

    • Over budget if under 0.

SVSchedule VarianceDetermines if the project is ahead or behind budget

EV - PV

    • Ahead of schedule if over 0.

    • Behind schedule if under 0.

SV% = SV / PB

    • Convert SV to Percentage
VACVariance At Completion

Determines whether the project will finish under or over budget

BAC - EAC

    • Under budget if over 0.

    • Over budget if under 0.

VAC% = VAC / PB

    • Convert VAC to Percentage


Forecast

ETC

Estimate To Complete

Estimated cost of the project at the end of the project

ETC = (BAC - EV) / CPI     

EACEstimate At Completion

Estimated cost required to complete the remainder of the project

EAC = BAC / CPI    

EACtTime Estimate At Completion

Rough estimate in working days of when the project will be completed

(BAC / SPI) / (BAC / total planned time)