This is the documentation for an older version of Folio and has been moved to the Tempo instance.
Please view the Folio Category in the Tempo Products Wiki Categories for all versions of Folio's Documentation.
Folio Overview
- JeanH (Deactivated)
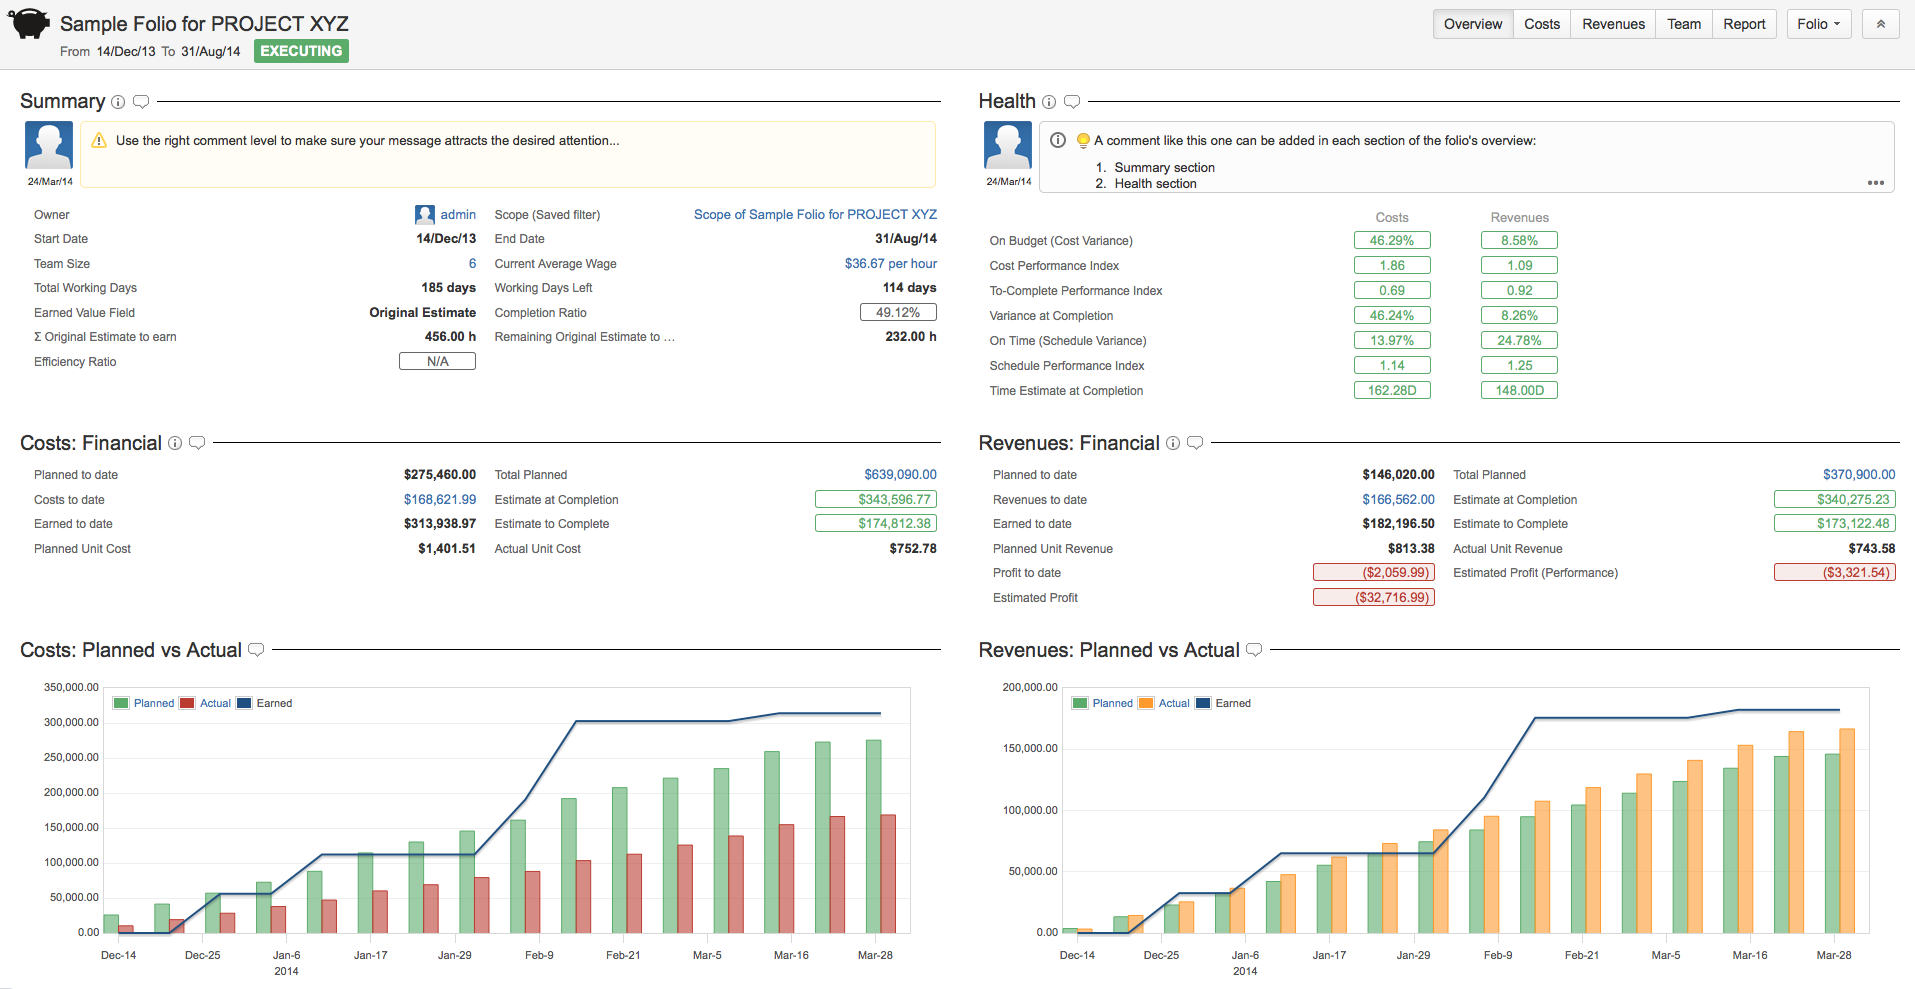
The Folio Overview page allows you to see the current performance and progress of a Folio. It is subdivided into a number of sections that depends whether the Folio is tracking revenues or not. Overview sections are:
| ||||||||||||||||||||||||||||||||||||||||||||||||||||||||||||||||||||||||||||||||||||||||||||||||||||||||||||||||||||||||||||||||||||||||||
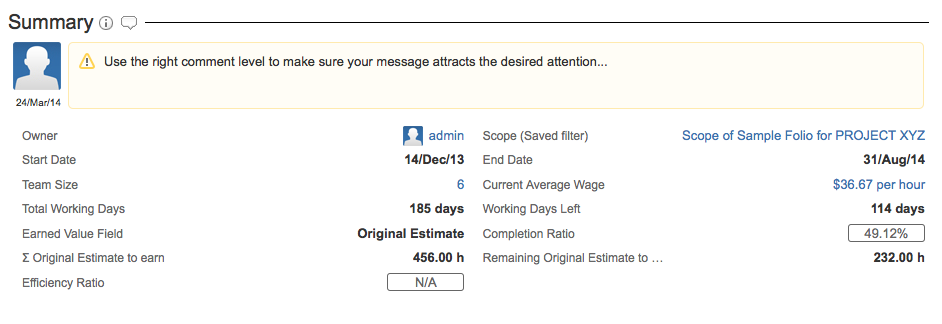
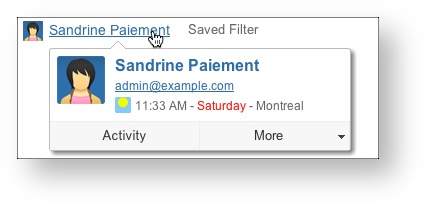
| Owner | Current Owner of the Folio. Clicking on the name name will take you on his or her JIRA User information page. Hovering the mouse over the name will open an inline dialog box that offers more information and actions related to that user.
|
|---|---|
| Saved filter | JIRA Saved Filter defining the Folio's Scope. Clicking on the Saved Filter takes you to its definition. |
| Start Date | Date from which expenses and revenues defined in the folio are taken into account. This is the start date of the project |
| End Date | Date until which expenses and revenues defined in the folio are taken into account. This is the planned end date of the project. |
| Team Size | Number of members currently in the Folio Team. Clicking on Team size number takes you to the Folio Team. |
| Current Average Wage | Current average team member wage. Clicking on Current Average Wage takes you to the Folio Team. |
| Total Working Days | Total number of working days between the start and end date of the folio. Working days are computed based on the Folio's Working Schedule configuration. |
| Working Days Left | Number of working days left until the planned completion date. Working days are computed based on the Folio's Working Schedule configuration. |
| Earned Value Field | Numeric Issue Field used to determine the weight of each issue it terms of Earned Value when it is completed. Please refer to the Earned Value Field description of the Folio Configuration page for more details. |
| Indicates the sum of the Earned Value Field for all issues part of the folio's scope if no Targeted Earned Units have been specified else indicates the specified Targeted Earned Units. | |
| Remaining Earned Value Field | Indicates the sum of the Earned Value Field for all unresolved issues of the Folio. Unresolved issues are the ones with a status that is not in the list of statuses considered as completed, as defined by the Earned Issues in the Folio's configuration. |
| Completion Ratio | The proportion of Earned Value to date (defining earned value) vs the final Planned Value. It is computed by dividing the Earned Value to date by the final Planned Value. |
| Efficiency Ratio | [Only if Earned Value Field is set to Original Estimate] The efficiency ratio determines how well the effort was originally estimated. It is computed by dividing the sum of time spent on earned issues by the sum of their original estimates. A ratio lower than 100 indicates that the effort was underestimated. |
 | Inline Help. Clicking on the icon opens up an inline dialog containing definitions of elements displayed in section. Clicking on lozenges inside the same section or on some values opens inline help with the item's definition highlighted. |
 | Manage section Comments. Clicking the icon opens an inline dialog that lets you add or delete Comments of the section. |
Health
The Health section of the Overview shows the EVM metrics of the Folio. If Folio is tracking revenues, then two sets of EVM metrics are shown side by side, the first column showing Costs-based metrics, the second one showing Revenues-based metrics.
Folio with revenues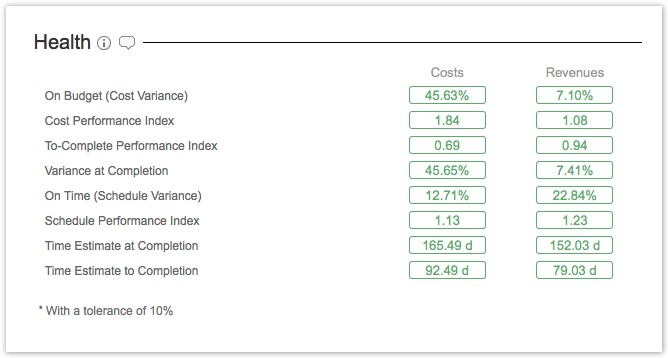
Folio without revenues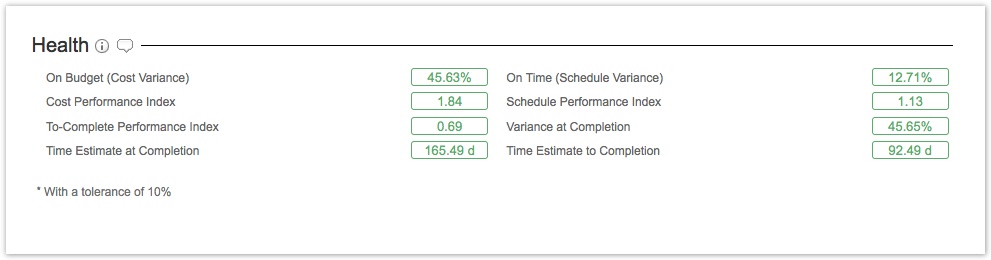
The following table describes the various fields of the Health section.
| On Budget (Cost Variance) | Cost Variance (CV) determines if the project is under or over the budget. It is computed by subtracting the Actual Cost from the Earned Value divided by the Earned Value. A negative value indicates that the project is over budget. |
|---|---|
On Time (Schedule Variance) | Schedule Variance (SV) determines whether the project is ahead of or behind schedule. It is computed by subtracting the Planned Value to date from the Earned Value divided by the Planned Value to date. A negative value indicates that the project is behind schedule. |
| Cost Performance Index | Cost Performance Index (CPI) determines how efficiently the team is using its resources. It is computed by dividing the Earned Value by the Actual Cost. A value lower than one indicates a loss of efficiency. |
Schedule Performance Index | Schedule Performance Index (SPI) determines how efficiently the project team is using its time. It is computed by dividing the Earned Value by the Planned Value to date. A value lower than one indicates a loss of efficiency. |
| To-Complete Performance Index | To-Complete Performance Index (TCPI) determines the efficiency that must be achieved on the remaining work for a project to meet the Budget at Completion. It is computed by dividing the work remaining (BAC - EV to date) by the budget remaining (BAC - AC to date). A value greater than one indicates that the performance must improve. |
| Time Estimate at Completion | Time Estimate at Completion (EACt) determines a rough estimate of how many total working days the project require to be complete given the current trend. It is compared to the planned number of working days do determine if it is positive or negative. It is computed by dividing the Total Working Days by the Schedule Performance Index (SPI). |
| Time Estimate to Completion | Time Estimate at Completion (ETCt) determines a rough estimate of how many working days are required to complete the project given the current trend. It is computed by simply subtracting the worked days from the estimated time at completion (EACt) |
| Variance at Completion | This index (VAC) determines whether the project will finish under or over budget. It is computed by subtracting the Estimate at Completion from the Budget at Completion, divided by the Budget at Completion. A negative value indicates how much more money will need to be injected to achieve the project goal. |
| Inline Help. Clicking on the icon opens up an inline dialog containing definitions of elements displayed in section. Clicking on lozenges inside the same section or on some values opens inline help with the item's definition highlighted. |
| Manage section Comments. Clicking the icon opens an inline dialog that lets you add or delete Comments of the section. |
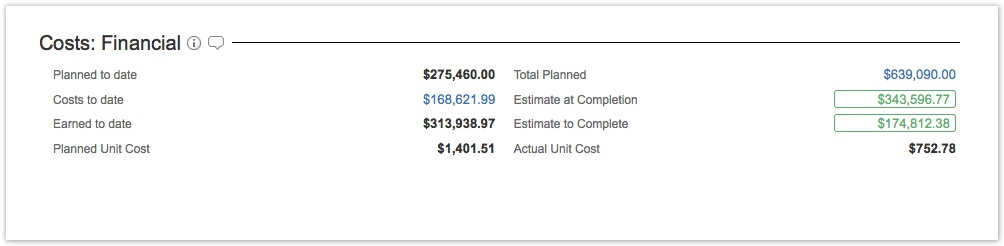
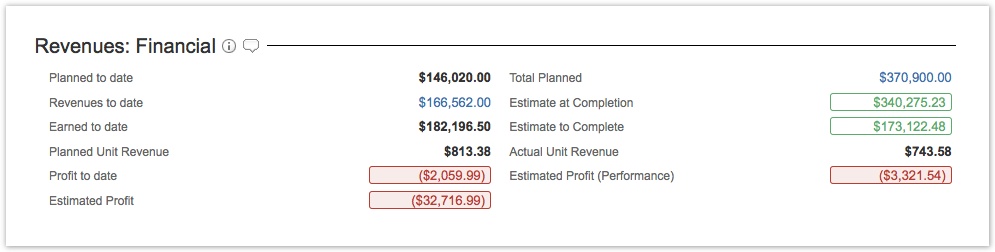
Financial
The Overview can show one or two Financial sections depending whether or not the Folio is tracking revenues. The Financial sections display a summary of money related information, such as planned, actual and earned value totals to date and forecasts based on current performance.
The following table describes the various fields of the financial sections.
| Planned to Date | Planned Value that should have been completed to date. This is the total costs or revenues planned as of today. |
|---|---|
Total Planned
| Total Planned Value for the Folio. This is the total planned cost or revenue of the entire Folio, from start date to end date. Clicking on the amount takes you to the Planned Costs or Planned Revenues, as appropriate. |
| Costs to Date | [Costs: Financial only] Actual cost of the Folio as of today. Clicking on the amount takes you to the Actual Costs screen. |
| Revenues to Date | [Revenues: Financial only] Actual revenue of the Folio as of today. Clicking on the amount takes you to the Actual Revenues screen. |
| Earned to date | Indicates the Earned Value as of today. It is a proportion of the Total Planned Value. This proportion is the sum of the Earned Value Field for all resolved issues divided by the sum of the Earned Value Field for all issues. |
| Estimate at Completion | Estimated total cost (or revenue) of the project at the estimated end of the project (when all current scope should be completed, given current performance). It is the highest value between the future known actual cost at completion and the computed value from the division between the Planned Value at Completion and the Cost Performance Index (CPI). See Forecasts tab for detailed projections. |
| Planned Unit Cost | Planned cost value of one unit of the Earned Value Field. It is computed by dividing the Total Planned Cost by the sum of the Earned Value Field for all issues of the Folio. Example: Given a Folio with issues totaling 100 Story Points and a budget of 100,000$, then Planned Unit Cost = 100,000$ / 100 = 1,000$. |
| Actual Unit Cost | Actual cost value of one unit of the Earned Value Field. It is computed by dividing the Actual Cost to date by the sum of the Earned Value Field for all completed issues of the Folio. Example: Given a Folio with completed issues totaling 50 Story Points and a cost to date of 100,000$, then Actual Unit Cost = 100,000$ / 50 = 2,000$. |
| Planned Unit Revenue | Planned revenue value of one unit of the Earned Value Field. It is computed by dividing the Total Planned Revenue by the sum of the Earned Value Field for all issues of the Folio. Example: Given a Folio with issues totaling 100 Story Points and a planned revenue of 200,000$, then Earned Unit Value = 200,000$ / 100 = 2,000$. |
| Actual Unit Revenue | Actual revenue value of one unit of the Earned Value Field. It is computed by dividing the Actual Revenue to date by the sum of the Earned Value Field for all completed issues of the Folio. Example: Given a Folio with completed issues totaling 50 Story Points and a cost to date of 200,000$, then Actual Unit Cost = 200,000$ / 50 = 4,000$. |
| Estimate to Complete | Estimated cost required (or revenue expected) to complete the project. It is the highest value between the future known actual cost (or revenue) at completion and the future estimated cost (or revenue) at completion. The future estimated value at completion is obtained by the subtraction of the Earned Value from the Planned value at completion, divided by the Cost Performance Index (CPI). |
| Profit to Date | [Revenues: Financial only] The Profit to date is the subtraction of the total revenues to date from the total costs to date. An amount greater than zero indicates that the project is currently profitable. |
| Estimated Profit (Performance) | The Estimated Profit based on performance is the estimated total profit at the end of the project based on the costs and revenues performance indexes. It is computed by subtracting the Estimated costs at completion from the Estimated revenues at completion. |
| Estimated Profit | The Estimated Profit is the estimated total profit at the end of the project based on the known costs and revenues. It is computed by subtracting the total known costs from the total known revenues at the end of the project. |
| Inline Help. Clicking on the icon opens up an inline dialog containing definitions of elements displayed in section. Clicking on lozenges inside the same section or on some values opens inline help with the item's definition highlighted. |
| Manage section Comments. Clicking the icon opens an inline dialog that lets you add or delete Comments of the section. |
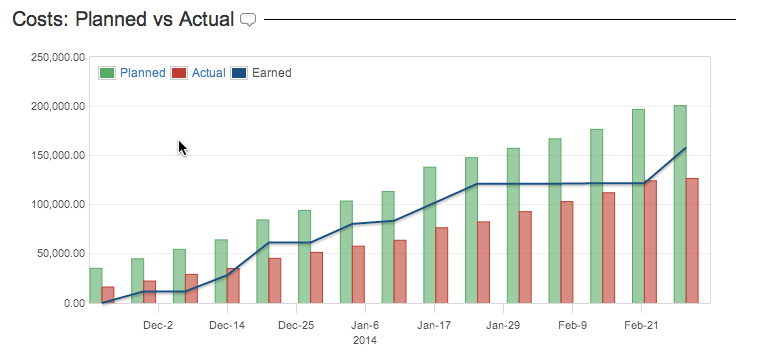
Budget vs Actual
The Overview can show one or two Budget vs Actual sections depending whether or not the Folio is tracking revenues. The Budget vs Actual sections show a chart showing the evolution of the Folio's Planned, Actual and Earned Values over time since the Folio's start date. Hovering the bars or curve brings up a tooltip with precise Date and Planned, Actual and Earned Values. Clicking on Budget or Actual links in the legend will bring you to the detailed Planned Costs or Actual Costs screens if in Costs chart, Planned Revenues or Actual Revenues if in Revenues chart.
 | 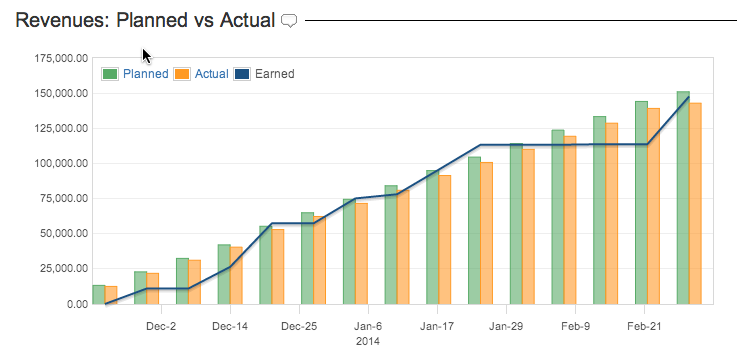 |
|---|
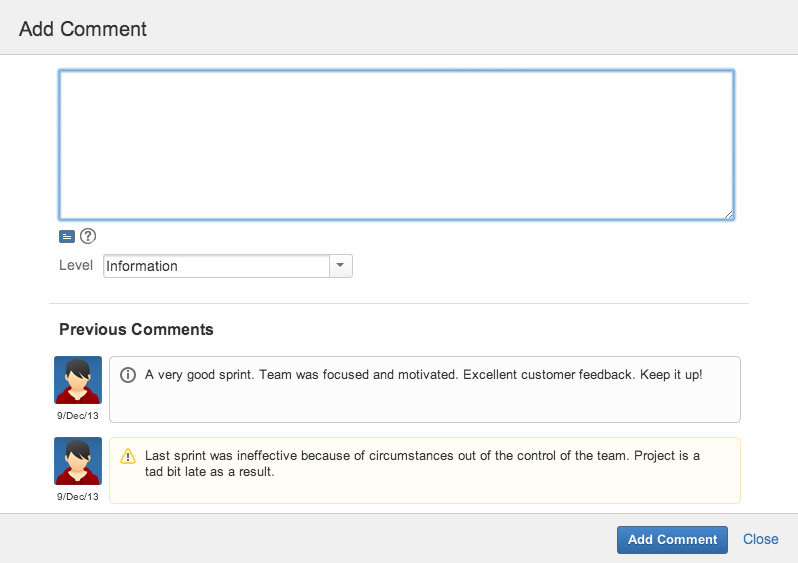
Comments
You can add comments in each section of the Overview, for both your Folios and Portfolios. At any time, only the last added comment per section is shown. Thus, if you add a new comment it will replace the previous one, if any. Comments also appear in the Steering Committee Report. To add a comment, click the bubble icon  located next to each section. This brings up a comment edition popup where you can write your message. Previous comments are displayed in a scrollable list underneath the edition panel.
The comment edition popup allows you to delete previous messages. To delete a comment, hover it with the mouse to make a trash can icon  appear in the top right corner. Click the trash can icon to delete it.
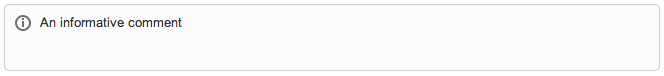
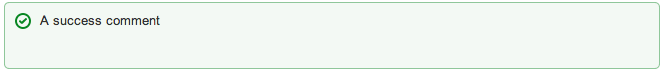
Comments can be assigned one of four pre-defined visibility levels, each one translating in an appropriate rendering to attract the right level of attention from the viewer. The levels are:
Information
Success
Warning
Important

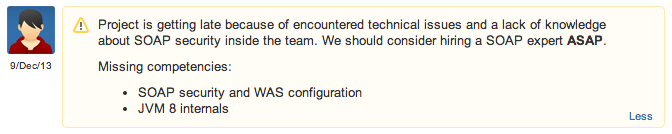
Writing Rich Comments
You can also write rich messages by adding wiki markup in your comments. This allows you to format your comments, add links, add lists, etc. Consult the complete reference for wiki markup for all details about what text effects options it gives you.
For technical reasons, wiki markup requires that the folio contains at least one issue to take effect. If the folio contains no issue, then entered text will be displayed as is, with no special rendering.
Editing a comment
The current (most recent) comment can be edited by hovering it in the Overview to make a pencil icon  appear in the top right corner. Click the icon to bring up the comment edition dialog. Edit the comment and save.
Acronyms
| Acronym | Definition | Description |
|---|---|---|
| PV | Planned Value | Planned Value at a given point in time. |
| AC | Actual Cost | Known cost of work performed at a given point in time. |
| EV | Earned Value | Measure of work performed at a given point in time. |
| BAC | Budget At Completion | Total Budget estimated. |
| Indices | ||
| CPI | Cost Performance Index | Determines how efficiently the team is using its resources. EV / AC
|
| SPI | Schedule Performance Index | Determines how efficiently the project team is using its time. EV / PV
|
| TCPI | To-Complete Performance Index | Determines the efficiency that must be achieved on the remaining work for a project to meet the Budget at Completion (BAC - EV) / (BAC - AC) |
| Variances | ||
| CV | Cost Variance | Determines if the project is over or under budget. EV - AV
|
| SV | Schedule Variance | Determines if the project is ahead or behind budget EV - PV
SV% = SV / PB
|
| VAC | Variance At Completion | Determines whether the project will finish under or over budget. BAC - EAC
VAC% = VAC / PB
|
| Forecast | ||
| ETC | Estimate To Complete | Estimated cost of the project at the end of the project ETC = (BAC - EV) / CPI |
| EAC | Estimate At Completion | Estimated cost to complete the project EAC = BAC / CPI |
| EACt | Time Estimate At Completion | Rough estimate in working days of when the project will be completed. (BAC / SPI) / (BAC / total planned time) |
Related pages: