This is the documentation for an older version of Folio and has been moved to the Tempo instance.
Please view the Folio Category in the Tempo Products Wiki Categories for all versions of Folio's Documentation.
Folio Forecast
- JeanH (Deactivated)
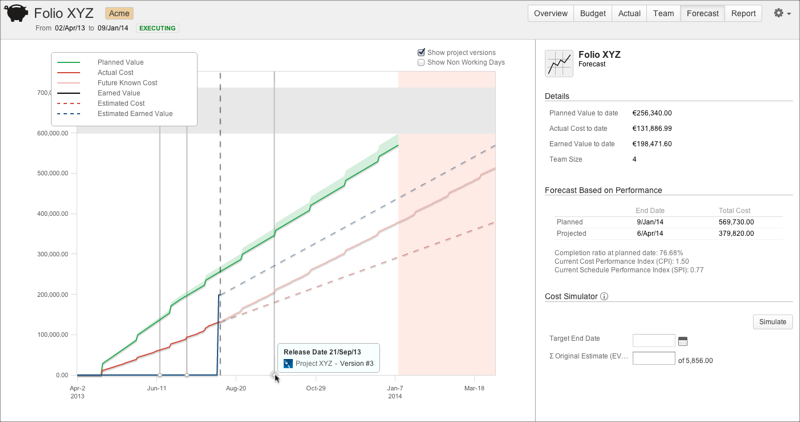
Available at the portfolios and folios level. The Forecast screen shows the evolution of the financial numbers of a Folio over time. It is divided in two sections:
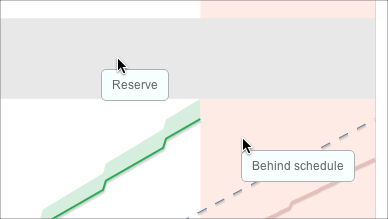
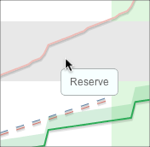
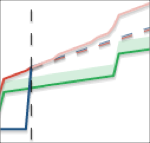
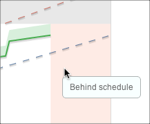
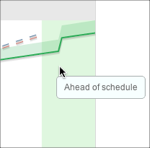
The ChartThe forecast chart displays various curves showing the evolution of financial numbers related to the current Folio. It spans on a period of time that covers the whole timeframe of the Folio, plus possibly a "Behind Schedule" period. The "Behind Schedule" period (pale red area at the extreme right of the chart) appears if the current performance indices of the Folio lead to an estimated end date later than the current configured end date of the Folio. Today's date is indicated by a vertical dashed line. Clicking on any series of the chart brings a tooltip that displays the detailed information at the selected point in time. Curves |
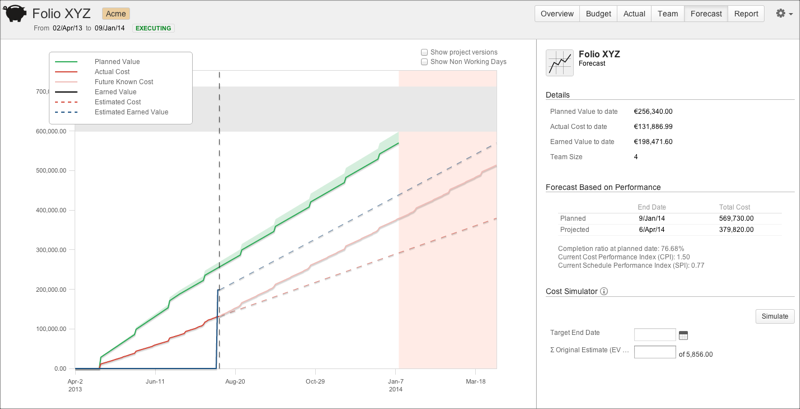


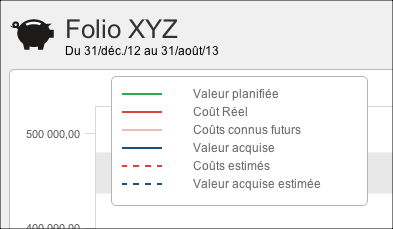
| Point selected - today or before | Point selected - in the future |
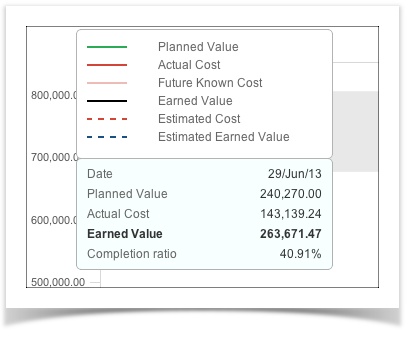 | 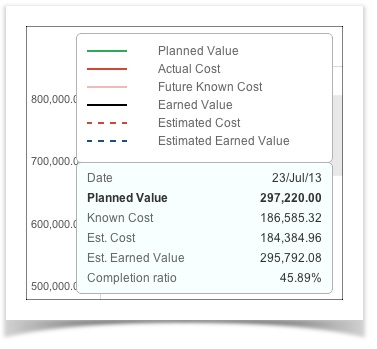 |
| Planned Value | Planned Value at the selected point in time. |
|---|---|
| Actual Cost | Actual Cost at the selected point in time. |
Earned Value | Earned Value at the selected point in time. |
| Known Cost | Known Cost at the selected point in time. |
| Est. Cost | Extrapolated Estimated Cost at the selected point in time. |
| Est. Earned Value | Extrapolated Earned Value at the selected point in time. |
| Completion ratio | Actual (or estimated if selection is in the future) completion percentage of the project at a specific point in time. |
Note that when point is selected, you can navigate to the next data point by typing " j ' or to the previous one by typing " k "
Show / Hide Non-Working Days
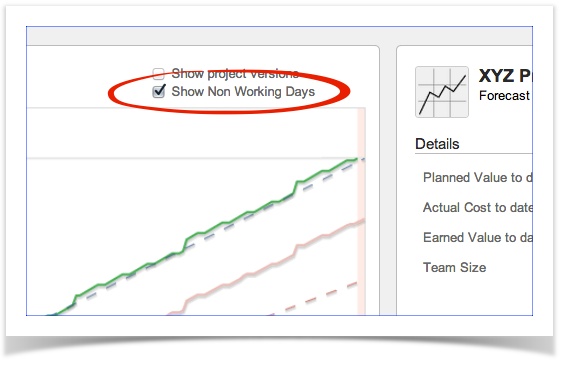
The "Show Non Working Days" option allows you to display weekend days and other configured non working days on the chart.
Show / Hide Project(s) Versions
The "Show Project Versions" option allows you to display the project Versions you defined in JIRA. All versions from all projects included in the folio scope will be shown when the option is selected.
Forecast details
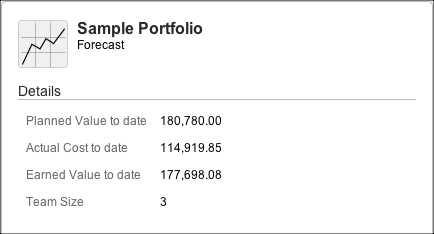
The Forecast details panel appears on the righthand side of the Forecast screen. It displays other financial details of interest.
Details section
This section displays the Planned Value, Actual Cost and Earned Value to date. Is also shows the current team size (assigned positions only).
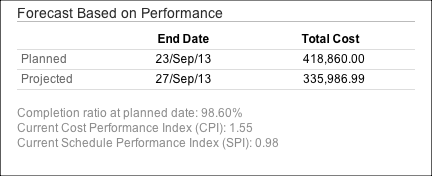
Forecast based on Performance
This section shows projections based on the performance indices, namely the Cost Performance Index (CPI) and Schedule Performance Index (SPI). It shows a comparison between planned and projected end dates as well as planned and projected total costs.
The 'Completion ratio at planned date' gives the estimated completion percentage at the planned end date based on the current trend (CPI).
The 'Current Cost Performance Index (CPI)' gives the value of the CPI used to estimate the projected cost. The 'Current Schedule Performance Index (SPI)' gives the value of the SPI used to estimate the projected end date.
Note that the Total Cost is the maximum value between the Estimated Cost (based on Cost Performance Index) and the total Future Known Cost.
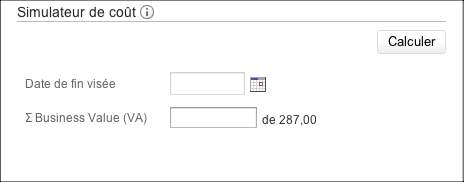
Cost Simulator (Folios only)
The Cost Simulator allows you to perform some simulations in order to get estimates, for instance, on the team size that would required to achieve a certain amount of earned value. For more details, see the Cost Simulator detailed documentation.