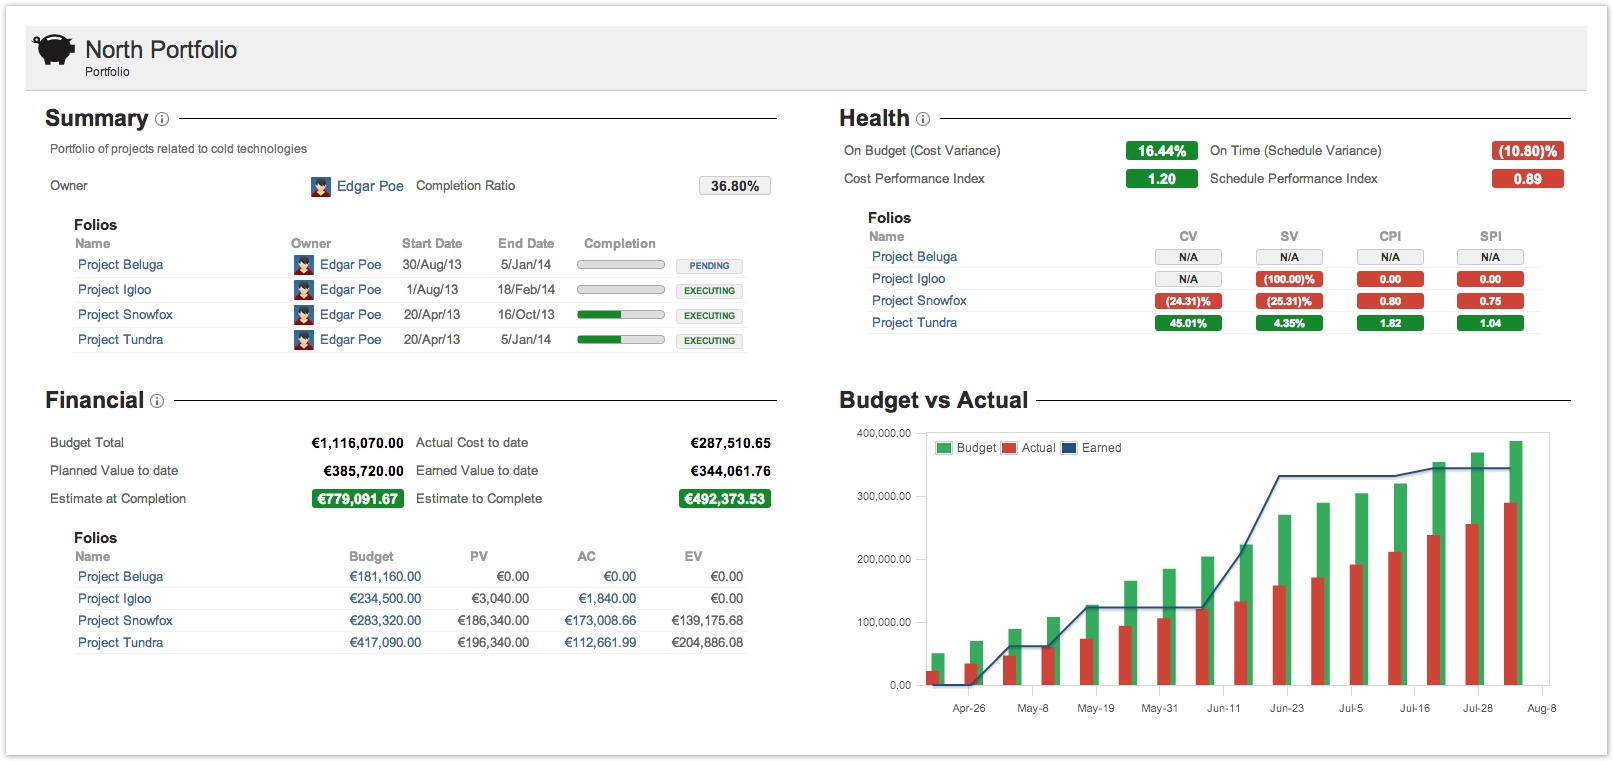
The Portfolio Overview page allows you to see the current performance and progress of a Portfolio, with all its associated Folios. It is subdivided into four sections: Summary, Health, Financial and Budget vs Actual. It allows you to get a quick overview and to navigate to individual Folios directly through links.
Summary
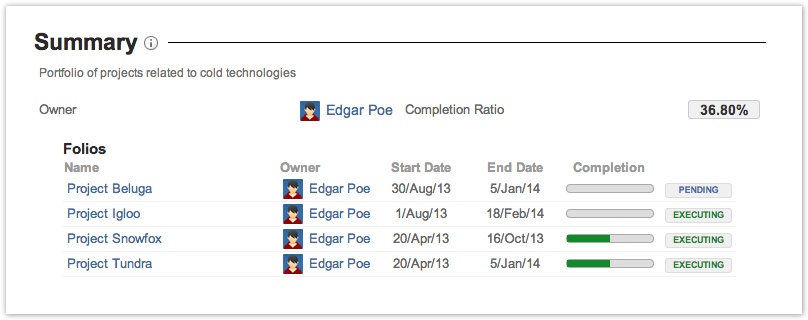
The summary section of the overview shows a summary description of the portfolio itself and its associated folios. It displays the Portfolio's description, if any, right under the section's header. The list of Folios belonging to that Portfolio are sorted alphabetically.
The following table describes the various fields of the summary section.
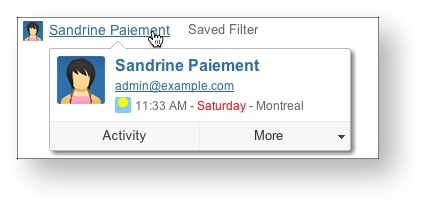
| Owner (portfolio) | Portfolio's owner. - Clicking on owner's name will take you on owner's JIRA User information page.
- Hovering the mouse over the owner's name will open an inline dialog box that offers more information and actions related to that user.
|
|---|
| Completion Ratio | Indicates how much Earned value was obtained in comparison with portfolio's total planned value (Budget). It is calculated by dividing the sum of folio's Earned value to date by the sum of folio's total planned value. |
|---|
| Name | The name of the folio. Clicking on it brings you to the Folio's overview. |
|---|
| Owner (folio) | Folio's owner. See notes above about Owner (portfolio) for details. |
|---|
| Start Date | Start date of the folio. This is the date at which expenses, earned value and metrics start being calculated for that folio. |
|---|
| End Date | End date of the folio. It defines the pace the team should maintain to successfully complete the folio scope. |
|---|
| Completion | Indicates how much Earned value was obtained in comparison with folio's total planned value (Budget). It is calculated by dividing the folio's Earned value to date by the folio's total planned value. |
|---|
| State | Indicates in which state the folio is: Pending, Executing, Closed or Expired. Pending if the folio's start date is in the future, Executing if today is between folio's start date and end date, Expired if folio's end date is in the past. |
|---|
 | Shows an inline definition of elements displayed in the section. Also, clicking on lozenges will display the clicked item's definition. |
|---|
Health
The Health section of the overview shows EVM metrics of the Portfolio itself along with the same metrics for each Folio belonging to it. Portfolio metrics are computed based on the aggregated information of its Folios.
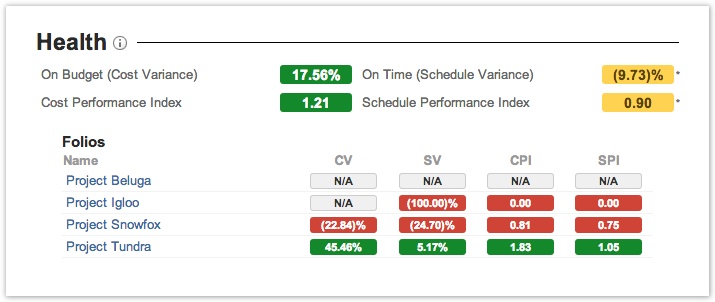
The following table describes the various fields of the health section. More details on various EVM metrics can be found in documentation of the Folio Overview.
| On Budget (Cost Variance) / CV | Determines if the portfolio or project is under or over the budget. It is computed by subtracting the Actual Cost from the Earned Value and then dividing by the Earned Value.
A negative value indicates that the project is over budget. |
|---|
On Time (Schedule Variance) / SV | Determines whether the portfolio or project is ahead or behind schedule. It is computed by subtracting the Planned Value to date from the Earned Value and then dividing by the Planned Value to date.
A negative value indicates that the project is behind schedule. |
|---|
| Cost Performance Index / CPI | Determines how efficiently the team is using its resources. It is computed by dividing the Earned Value by the Actual Cost.
A value lower than one indicates a loss of efficiency. |
|---|
Schedule Performance Index / SPI | Determines how efficiently the project team is using its time. It is computed by dividing the Earned Value by the Planned Value to date.
A value lower than one indicates a loss of efficiency. |
|---|
| Clicking on information icon will show you online definitions of elements displayed in the health section. Also, clicking on lozenges will display the clicked item's definition. |
|---|
Financial
The Financial section displays money related information, such as budget, actual and earned value totals to date and estimates.
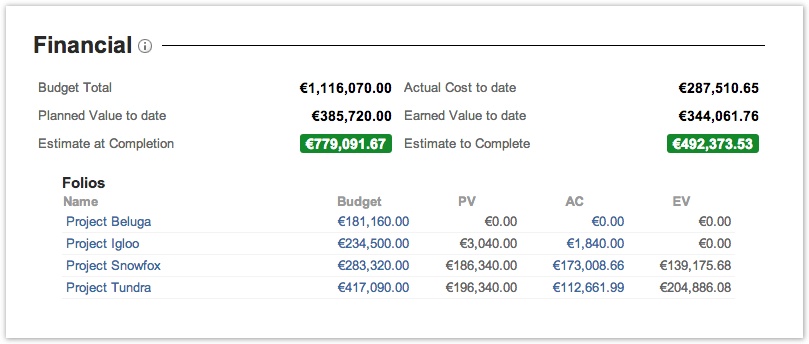
The following table describes the various fields of the financial section.
| Budget Total | Total planned budget for the current portfolio. It is the sum of the Budget totals of its Folios. |
|---|
| Actual Cost to date | Actual cost as of today. It is the sum of the Actual Cost to Date of its Folios. |
|---|
| Planned Value to date | Planned (budgeted) value as of today. |
|---|
| Earned Value to date | Earned Value for work items (issues) of its Folios that have been completed as of today. |
|---|
| Estimate at Completion | The Estimate at Completion (EAC) is the estimated cost at the end of the project that ends with the latest date. It is the highest value between the future known actual cost at completion and the division between the Planned Value at Completion and the Cost Performance Index (CPI). |
|---|
| Estimate to Complete | The Estimate to Complete (ETC) is the estimated cost required to complete all projects in the portfolio. It is the highest value between the future known actual cost at completion and the subtraction of the Earned Value from the Planned value at completion, divided by the Cost Performance Index (CPI). |
|---|
| List of Folios |
|---|
| Name | The name of the folio. Clicking on it brings you to the Folio's overview. |
|---|
| Budget | Total planned budget of the Folio. Clicking on the amount brings you to the Folio's Budget. |
|---|
| PV | Planned (budgeted) value of the Folio as of today. |
|---|
| AC | Actual cost of the Folio as of today. Clicking on the amount brings you to the Folio's Actual. |
|---|
| EV | Earned Value for Folio's work items (issues) that have been completed. |
|---|
| Clicking on information icon will show you online definitions of elements displayed in the health section. Also, clicking on lozenges will display the clicked item's definition. |
|---|
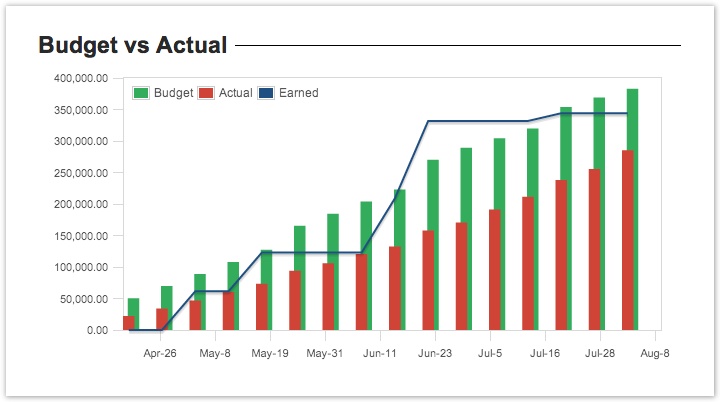
Budget vs Actual
The Budget vs Actual section shows a chart that displays portfolio's total planned value, actual cost and earned value over time, week by week. The chart starts at the start date of the earliest of its Folios. Clicking on the bars or line will open a tooltip with precise Planned value, Actual cost and Earned value at the end of the selected week.
The following is an example Budget vs Actual chart of a portfolio.