Portfolio Team
- JeanH (Deactivated)
- FrancoisL (Deactivated)
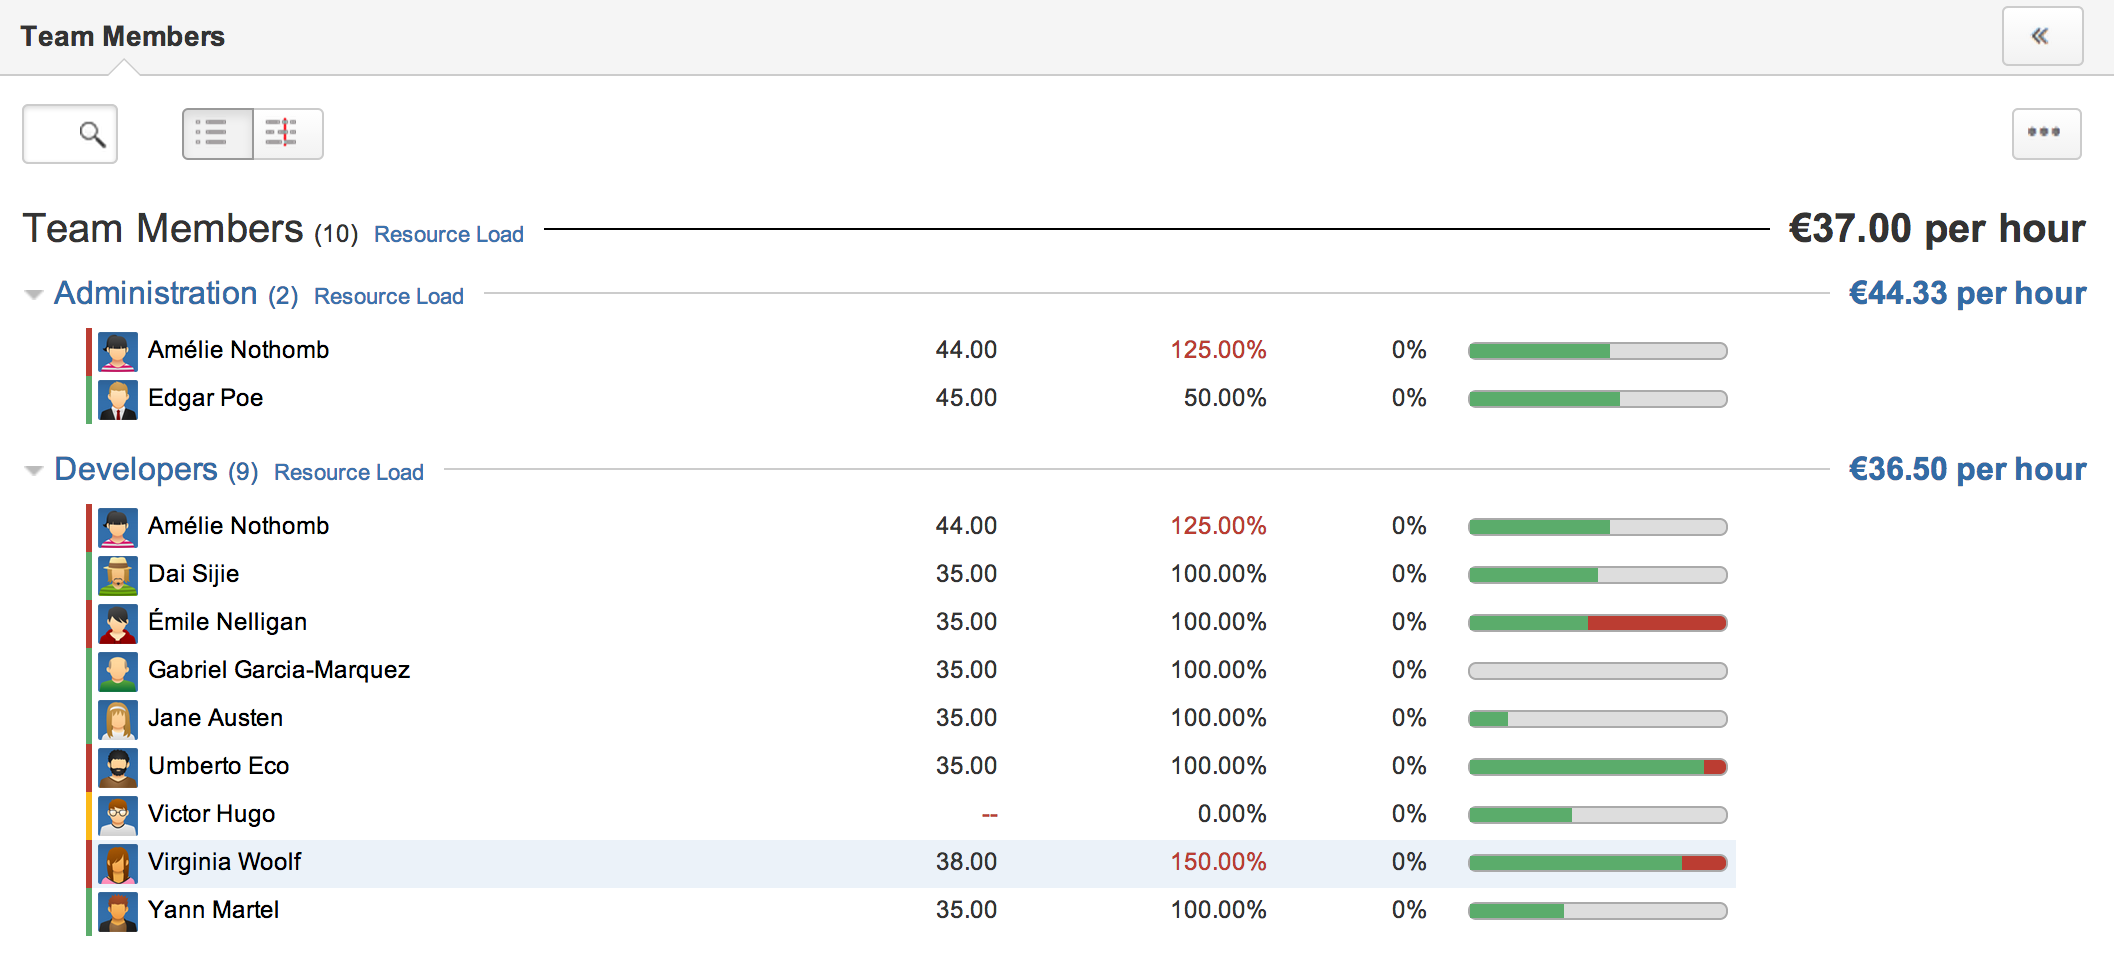
The Portfolio Team screen allows you to easily monitor everyone working on any of a Portfolio's project teams. It gives you a cross-project view of people that you can use to discover who is over-allocated or overloaded (i.e. assigned too much work for the time allocated). It also allows you to see cost rates, allocations and worked hours information as well as a quick summary of the issues each person is working on. |
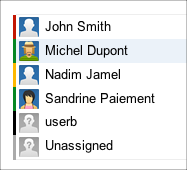
 | Active member who is not overloaded. |
 | Member has no current allocation and thus is not yet active. |
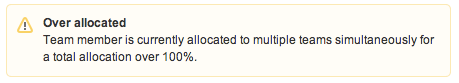
 | Member is overloaded (see resource load) or over-allocated (is allocated to multiple projects for a total over 100%). |
 | Unfulfilled position; an team position that as not yet beed assigned a JIRA user. |
 | Position is associated with a JIRA user who has been deleted. |
Avatar
Image representing the team member, as defined in the associated JIRA user's profile.
Name
Full name of the member. Hovering the name brings up the standard JIRA user popup.
Current average cost rate
The current average cost rate of the user. This is the average of the member's current cost rates defined for each active project she is associated with in the portfolio, weighted by the allocation % per project. If member has no cost rate defined, '–' is displayed. Note that only active members are taken into account. That is, wages occurring before folio's start date or after folio's closing or end (expiration) dates are ignored.
Allocation
The current total allocation of the user across all portfolio's projects. Only the active projects are considered when calculating the total, that is, allocation before folio's start date or after the end of expired or closed projects are ignored.
Overhead
An aggregation of the team member's overhead for each folio in the current portfolio. The overhead of a folio gives a ratio of the amount of work that was not credited to the folio. It is computed by subtracting the number of worked hours from the capacity to date (as defined by the member's allocation percentage to the folio) and dividing the result by the capacity to date.
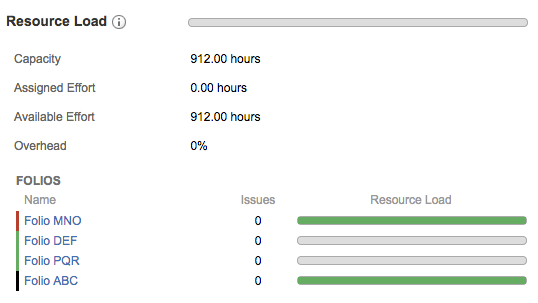
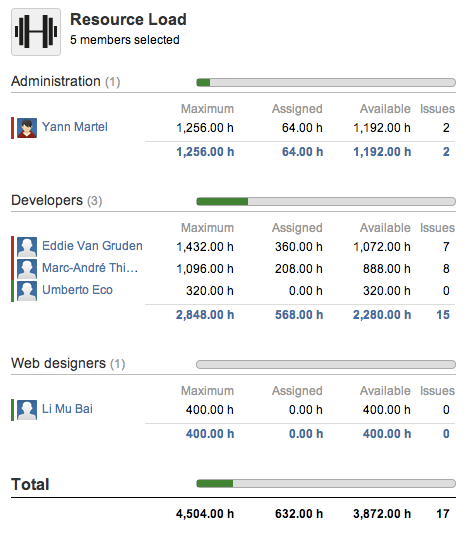
Resource Load
A coloured bar widget showing the aggregated resource load information for all assignations of the team member. If the assigned hours exceed the capacity, then a proportional part of the bar is shown in red, indicating that the member is overloaded. Hover the bar to get the precise resource load in hours.
Timeline View
The Timeline View is displayed when the right part of the toggle button is pressed ![]() . It shows each team member's past worked hours and future capacity over the Portfolio's timeframe as an interactive timeline chart. Each bar displayed for a team member on the timeline reflects changes in that member's allocation, as defined in Folios included in the Portfolio. The future capacity of a team member for each allocation period is derived from the allocation percentage(s) for that period, and the working days and hours as defined by the Work Schedule of the Folios the member is allocated to.
. It shows each team member's past worked hours and future capacity over the Portfolio's timeframe as an interactive timeline chart. Each bar displayed for a team member on the timeline reflects changes in that member's allocation, as defined in Folios included in the Portfolio. The future capacity of a team member for each allocation period is derived from the allocation percentage(s) for that period, and the working days and hours as defined by the Work Schedule of the Folios the member is allocated to.
Timeline charts in FOLIO offer various controls to navigate and focus on certain periods of time. Please refer to the Timelines page to learn more on available ways to interact with the Timeline.
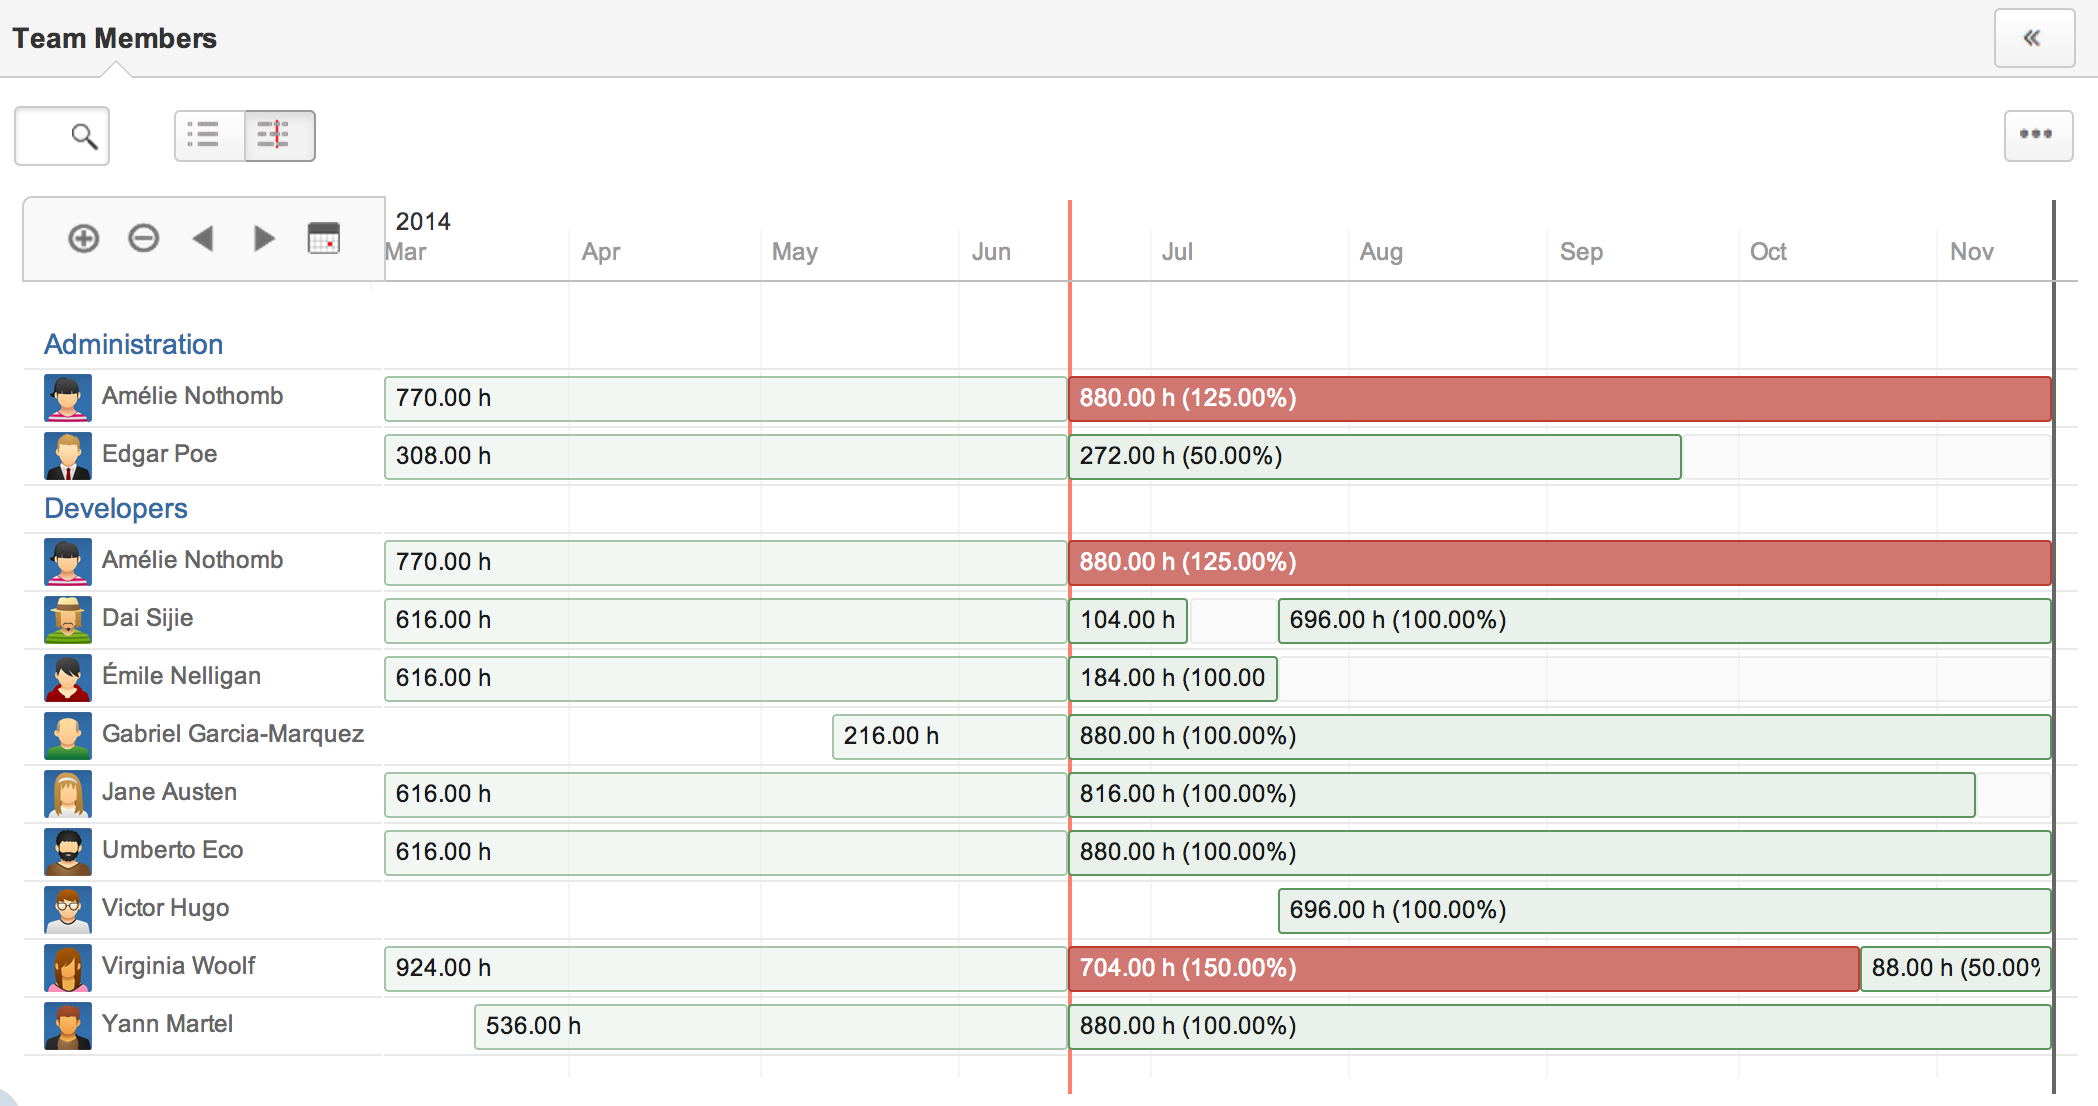
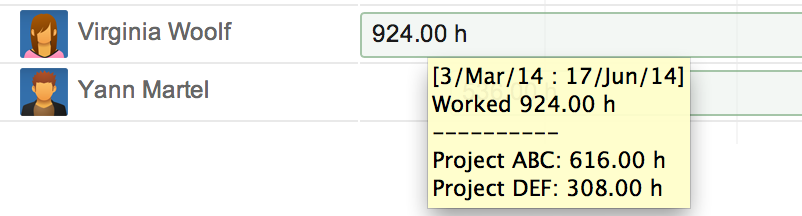
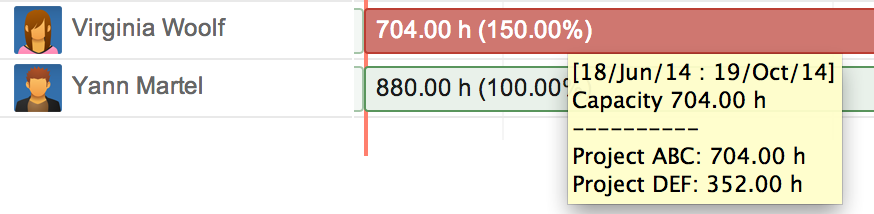
The Team Timeline is divided in two parts by the "Today" marker (displayed as a red vertical line on the chart). All hours shown on the left of the Today marker (past period from the Portfolio's start date to today, included) are hours worked by each team member. Hours shown on bars at the right of the marker (future, until the Portfolio's end date) indicate the capacity of the resource for each allocation period. Since the allocations shown in the team timeline are aggregated from possibly more than one Folios, the allocation for a given period can sum up to over 100%, in which case, the allocation period is displayed in red.

Hovering one of the bars shows the time period corresponding to that bar and either the number of worked hours or capacity for that period. If a past period aggregates worked hours from two Folios or more, then the tooltip shows the break down of hours worked per Folio.
Similarly, when a future period aggregates capacity from two Folios or more, hovering it brings up a tooltip showing the break down of allocated capacity per Folio.
Inactive periods
Inactive periods, e.g. periods with an allocation percentage of zero are shown as faded gray bars, showing when each team member is on vacation or when the member's commitment to that project is planned to end.
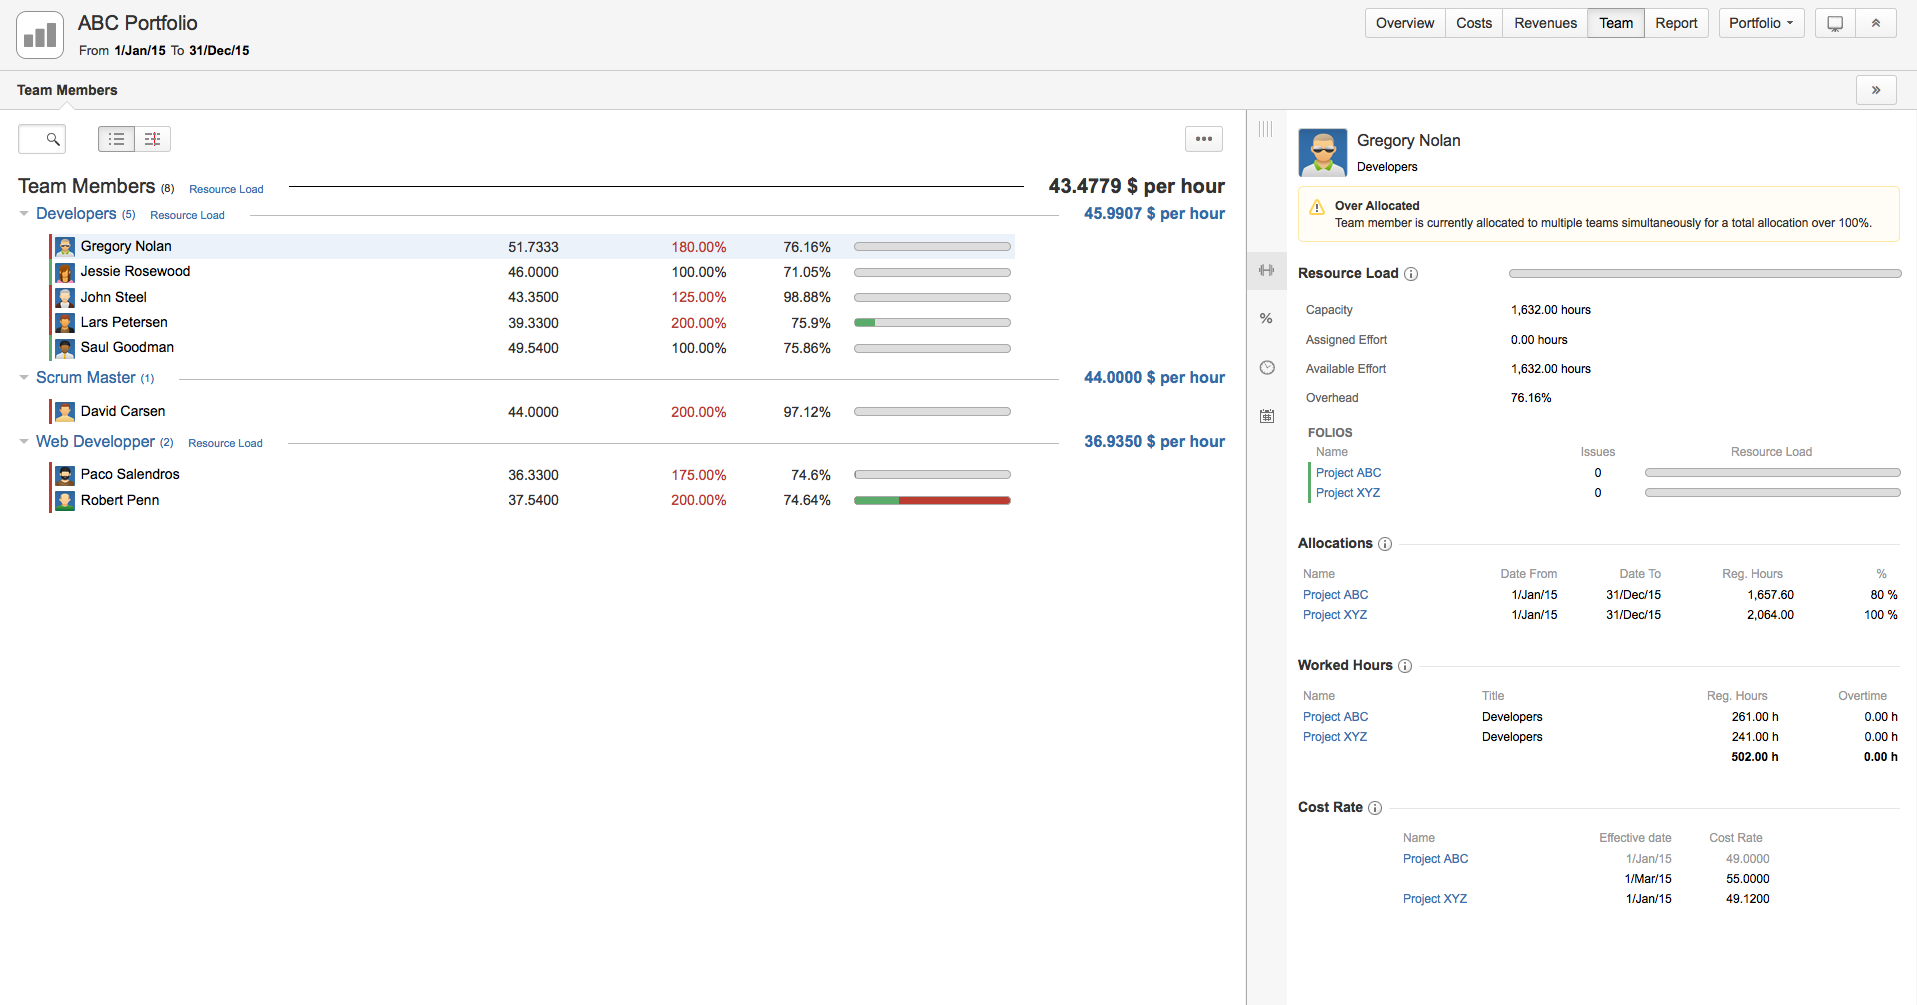
Viewing a Team Member's Details
Clicking on a team member row in the Team browser brings up the team member details panel on the right-hand side of the screen, showing the detailed information of that member.
Single team member selection
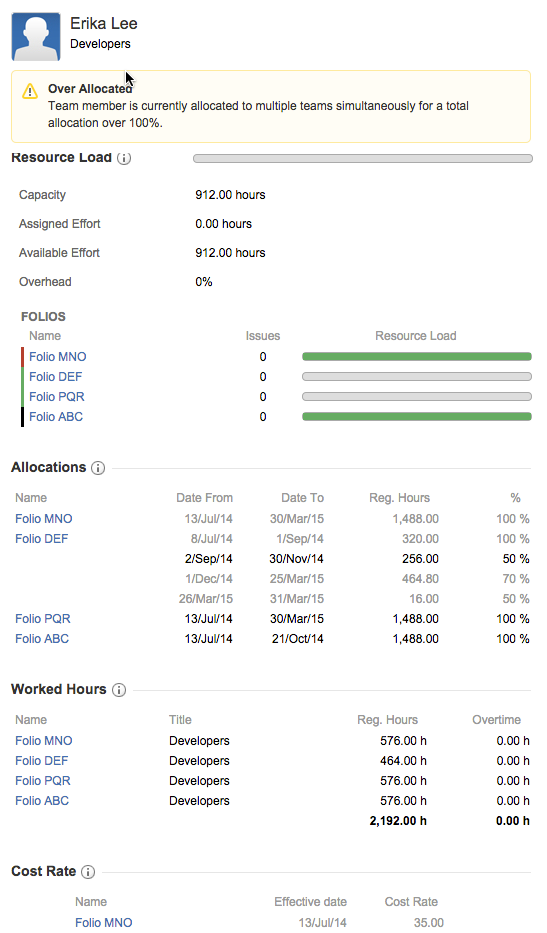
When a single team member is selected by left-clicking on it in the team browser, the single team member details appear on the right. These information include the resource's work load, her positions, her cost rates and worked hours.
Summary
The team member's summary is the header of the details panel and shows the avatar of the user, her full name and the list of roles she has across projects of the current portfolio.

The summary can also show warnings, depending on the status of the selected person.
Resource Load
The resource load section shows the detailed aggregated resource load information plus a breakdown by Folio. It allows to get a quick view of JIRA issues that are currently assigned to the team member across the Portfolio's projects. For more information, refer to the Resource load documentation.
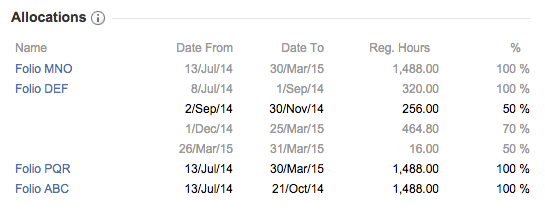
Allocation
The Allocations section shows all allocations defined per Folio for the selected team member. If a Folio is Closed before its end date then the allocations displayed will end on close date.
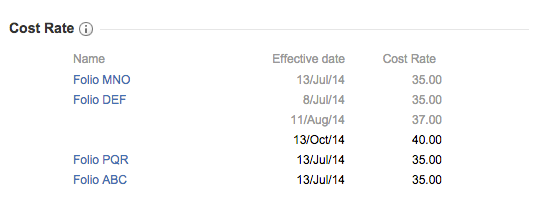
Cost rates
The Cost rates section shows all cost rates defined per Folio for the selected team member.
An asterisk that appears to the right of a cost rate indicates that money conversion has been applied to the amount. Hovering the mouse over the asterisk brings up a tooltip showing the currencies and exchange rate used.
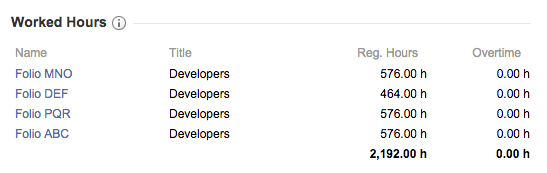
Worked Hours
The worked hours section shows the total number of worked hours per Folio by the selected member, and the overall total for the Portfolio. It also displays the position title (or role) the person currently has in each folio.
Multiple team members selection
When multiple team members are selected, the aggregated resource load information for the selected members is displayed on the right.
Refer to the Folio Team documentation on Resource Load for all details.
Video: