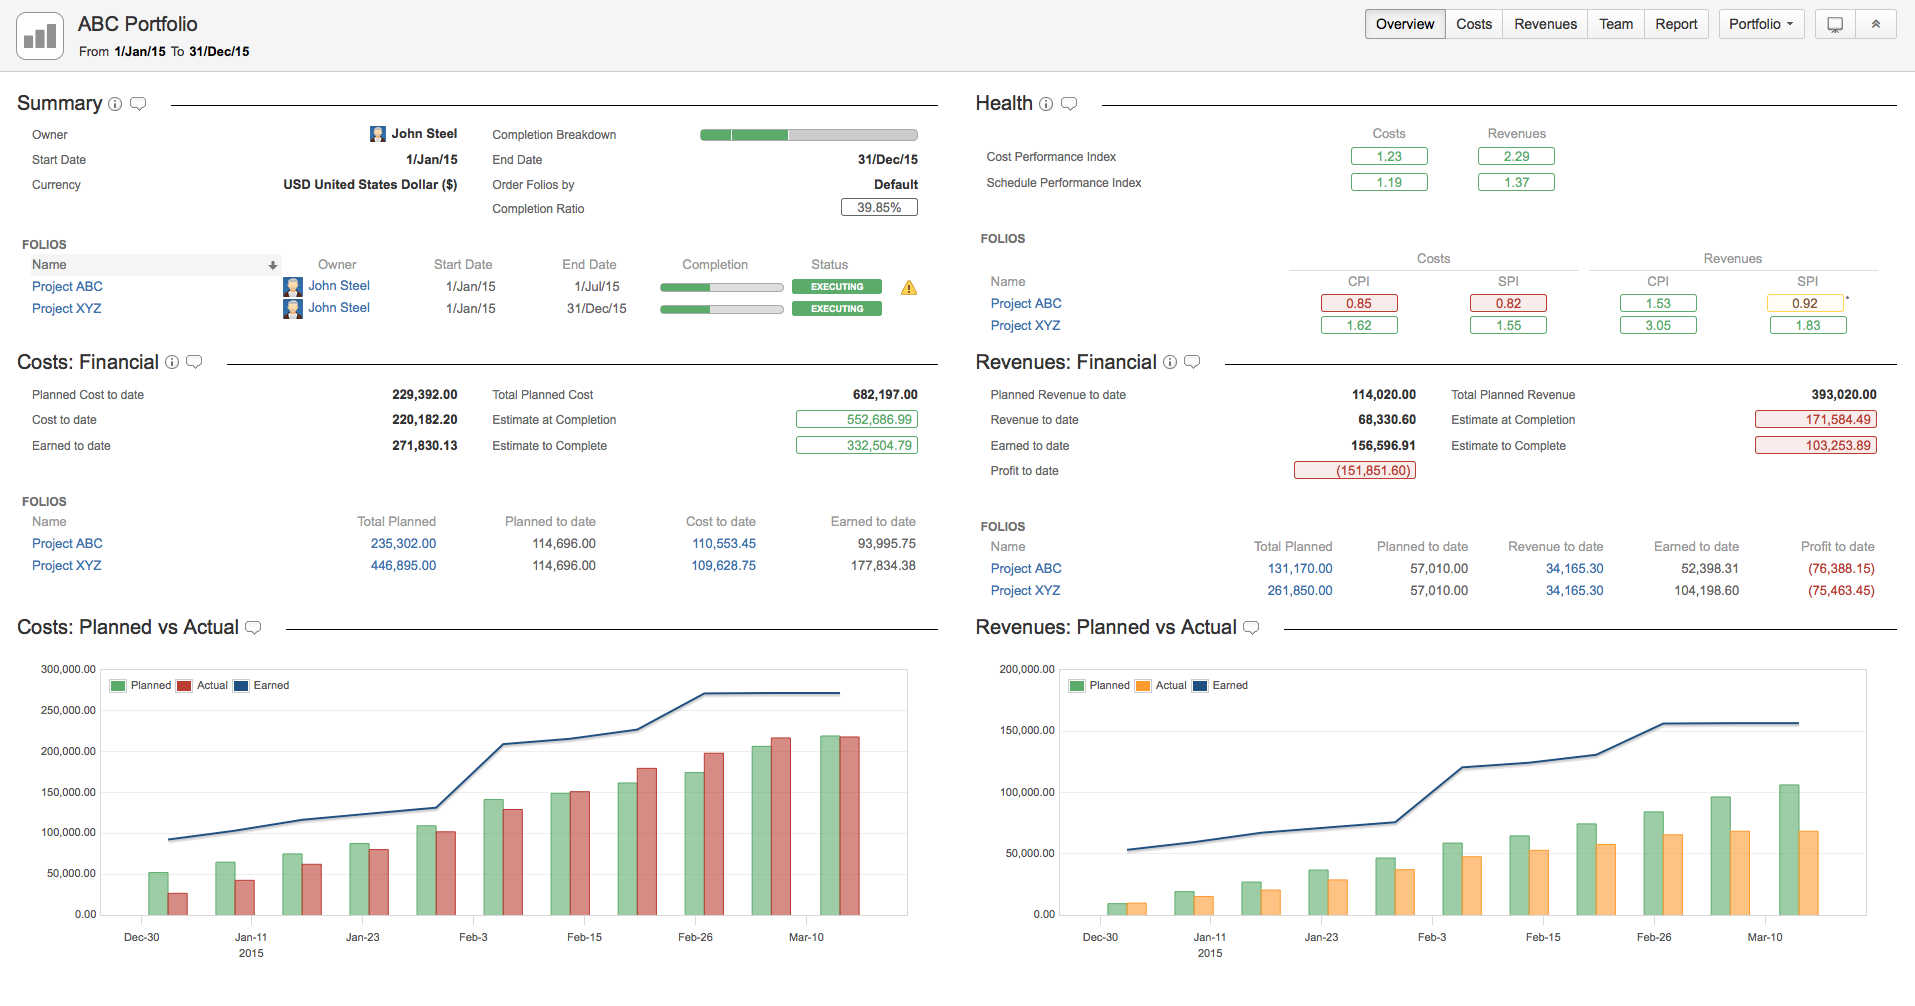
The Portfolio Overview page allows you to see the current performance and progress of a Portfolio, with all its associated Folios. It is subdivided into four sections: Summary, Health or Comments (when not using EVM), Financial and Budget vs Actual. Two extra sections are displayed if at least one Folio in the Portfolio is tracking revenues. It allows you to get a quick overview and to navigate to the various tabs of individual Folios directly.
Summary
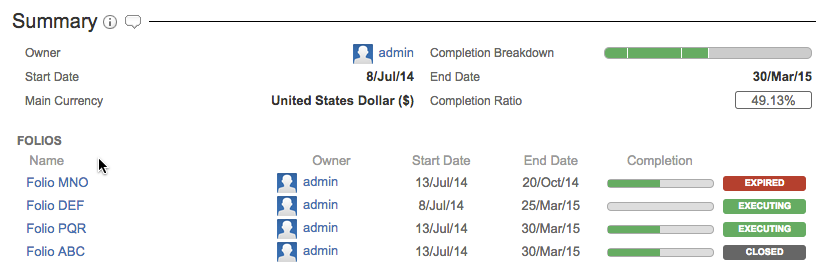
The summary section of the overview shows a summary description of the Portfolio itself and its associated Folios. It displays the Portfolio's description, if any, right under the section's header.
The following table describes the various fields of the summary section.
| Owner (portfolio) | Current owner of the Portfolio. Clicking on the name will take you on his or her JIRA User information page. Hovering the mouse over the name will open an inline dialog box that offers more information and actions related to that user. 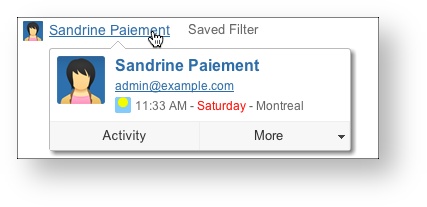
|
|---|
| Completion Ratio | The proportion of Earned Value to date (defining earned value) vs the final Planned Value. It is computed by dividing the total Earned Value to date of all Folios included in this Portfolio by the sum of their total Planned Value. |
|---|
| Main currency | Currency used to display amounts in this Portfolio. Portfolios can contain Folios with many different currencies. When a Portfolio contains one or more Folios using a different currency, FOLIO automatically converts all these Folio's amounts of money to the Portfolio's currency. FOLIO uses Yahoo's Finances web services to retrieve the current exchange rate(s) in order to do that conversion. Exchange rates are cached for a 24 hours period in order to avoid heavy traffic between FOLIO and Yahoo's servers. Thus once fetched, exchange rates are refreshed only once per 24 hours. You can refresh rates manually by clicking Refresh xRates item in the Portfolio drop-down menu. 
|
|---|
| Completion Breakdown | Portfolio's overall completion ratio, broke down by Folio. The size of a Folio's contribution to overall completion is proportional to both its own Completion ratio and its relative weight in terms of total planned value. 
|
|---|
| Name | Name of the folio. Clicking on it brings up that Folio's overview. |
|---|
| Owner (folio) | Current owner of the Folio. See notes above about Owner (portfolio) for details. |
|---|
| Start Date | Date from which expenses and revenues defined in the folio are taken into account. This is the start date of the project |
|---|
| End Date | Date until which expenses and revenues defined in the folio are taken into account. This is the planned end date or closed date (if any) of the project, whichever is earlier. |
|---|
| Completion | The proportion of Earned Value to date (defining earned value) vs the final Planned Value. It is computed by dividing the Earned Value to date by the final Planned Value. |
|---|
| State | Indicates in which state the Folio currently is: Pending, Executing, Closed or Expired. |
|---|
 | Inline Help. Clicking on the icon opens up an inline dialog containing definitions of elements displayed in section. Clicking on lozenges inside the same section or on some values opens inline help with the item's definition highlighted. |
|---|
 | Manage section Comments. Clicking the icon opens an inline dialog that lets you add or delete Comments of the section. |
|---|
Sorting of Folios
In the Portfolio Overview, each section containing detailed information per Folio lists them in an order that is defined by a series or rules. The default sorting order of Folios is defined as follows:
- By Folio status with the following priority: EXPIRED, EXECUTING, PENDING, CLOSED
- By end date, from earliest to latest
- By alphabetical name
You can also select a Folio Custom Field to be used for sorting. The default Folio Custom Field used for sorting Folios in Portfolios is defined in the Global Configuration. Furthermore, you can select a sorting field specific to a Portfolio by editing its Order by and Order option settings.
Health
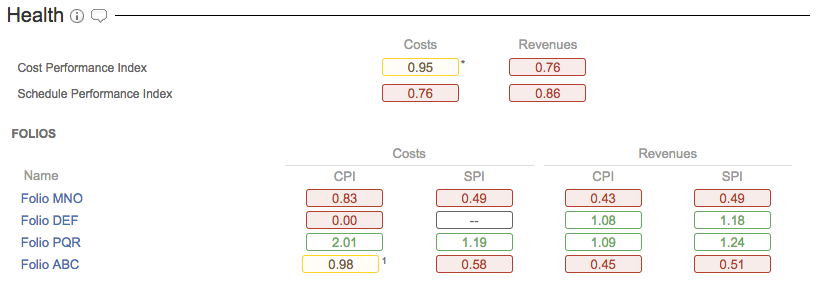
The Health section of the overview shows aggregated EVM metrics of the Portfolio along with the main EVM metrics of each Folio it contains. The metrics shown depend whether the Portfolio contains revenues tracking Folios or not. If so, the Health section will focus on Cost Performance Index (CPI) and Schedule Performance Index (SPI). If the Portfolio contains only costs tracking Folios, then Health section also displays Cost Variance (CV) and Schedule Variance (SV) indices of the Portfolio and its Folios.
The following table describes the various fields of the health section. Please refer to Folio Overview's documentation for more details on EVM metrics.
| On Budget (Cost Variance) / CV | [Only if Portfolio contains no revenues tracking Folio] Cost Variance (CV) determines if the project is under or over the budget. It is computed by subtracting the Actual Cost from the Earned Value divided by the Earned Value. A negative value indicates that the project is over budget. |
|---|
On Time (Schedule Variance) / SV | [Only if Portfolio contains no revenues tracking Folio] Schedule Variance (SV) determines whether the project is ahead of or behind schedule. It is computed by subtracting the Planned Value to date from the Earned Value divided by the Planned Value to date. A negative value indicates that the project is behind schedule. |
|---|
| Cost Performance Index / CPI | Cost Performance Index (CPI) determines how efficiently the team is using its resources. It is computed by dividing the Earned Value by the Actual Cost. A value lower than one indicates a loss of efficiency. |
|---|
| Schedule Performance Index / SPI | Schedule Performance Index (SPI) determines how efficiently the project team is using its time. It is computed by dividing the Earned Value by the Planned Value to date. A value lower than one indicates a loss of efficiency. |
|---|
| Inline Help. Clicking on the icon opens up an inline dialog containing definitions of elements displayed in section. Clicking on lozenges inside the same section or on some values opens inline help with the item's definition highlighted. |
|---|
| Manage section Comments. Clicking the icon opens an inline dialog that lets you add or delete Comments of the section. |
|---|
When no Folio in a Portfolio is not using EVM, the Health section is replaced with an extra space for entering comments. Entering comments is done the same way as adding comments in other sections of the Overview.
Financial
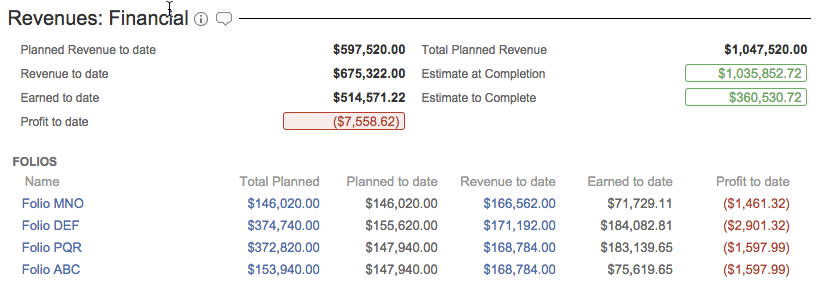
The Overview can show one or two Financial sections depending whether or not the Portfolio contains at least one revenues tracking Folio or not. The Financial sections display a summary of money related information, such as planned, actual and earned value totals to date and forecasts based on current performance.
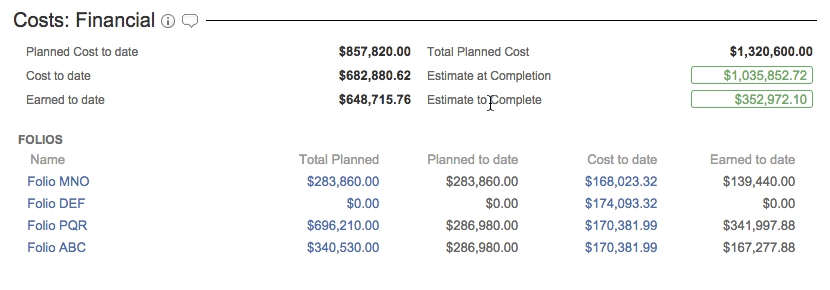
The following table describes the various fields of the financial section.
| Planned to Date | Total Planned Value that should have been completed to date. This is the sum of Planned Value to date of all Folios associated to the current Portfolio. |
|---|
| Total Planned | Total Planned Value for the Portfolio. This is the sum of total planned value of all Folios associated to the current Portfolio. |
|---|
| Costs to Date | [Costs: Financial only] Actual cost of the Portfolio as of today. This is the sum of Costs to Date of all Folios associated to the current Portfolio. |
|---|
| Revenues to Date | [Revenues: Financial only] Actual revenue of the Portfolio as of today. This is the sum of Revenues to Date of all Folios associated to the current Portfolio. |
|---|
| Earned to date | Earned Value of the Portfolio as of today. This is the sum of Earned Value to Date of all Folios associated to the current Portfolio. |
|---|
| Estimate at Completion | Estimated total cost (or revenue) at the estimated end of this Portfolio's projects (when all current scope should be completed, given current performance). It is the highest value between the future known actual cost at completion and the computed value from the division between the Planned Value at Completion and the Cost Performance Index (CPI). See Forecasts tab for detailed projections. |
|---|
| Estimate to Complete | Estimated cost required (or revenue expected) to complete this Portfolio's projects. It is the highest value between the future known actual cost (or revenue) at completion and the future estimated cost (or revenue) at completion. The future estimated value at completion is obtained by the subtraction of the Earned Value from the Planned value at completion, divided by the Cost Performance Index (CPI). |
|---|
| Profit to date | [Revenues: Financial only] The Profit to date is the subtraction of the total revenues to date from the total costs to date. An amount greater than zero indicates that the project is currently profitable. |
|---|
| List of Folios |
|---|
| Name | Name of the folio. Clicking on it brings up that Folio's overview. |
|---|
| Total Planned | Total Planned Value for the Folio. This is the total planned cost or revenue of the entire Folio, from start date to end date. Clicking on the amount takes you to that Folio's Planned Costs or Planned Revenues, as appropriate. |
|---|
| Planned to Date | Planned Value that should have been completed to date. This is the total costs or revenues planned as of today. |
|---|
| Costs to Date | [Costs: Financial only] Actual cost of the Folio as of today. Clicking on the amount takes you to that Folio's Actual Costs screen. |
|---|
| Revenues to Date | [Revenues: Financial only] Actual revenue of the Folio as of today. Clicking on the amount takes you to that Folio's Actual Revenues screen. |
|---|
| Earned to date | [EVM only] Indicates the Earned Value of the Folio as of today. It is a proportion of the Total Planned Value. This proportion is the sum of the Earned Value Field for all earned issues divided by the sum of the Earned Value Field for all issues. |
|---|
| Profit to date | [Revenues: Financial only] The Profit to date is the subtraction of the total revenues to date from the total costs to date of the folio. An amount greater than zero indicates that the folio is currently profitable. |
|---|
| Inline Help. Clicking on the icon opens up an inline dialog containing definitions of elements displayed in section. Clicking on lozenges inside the same section or on some values opens inline help with the item's definition highlighted. |
|---|
| Manage section Comments. Clicking the icon opens an inline dialog that lets you add or delete Comments of the section. |
|---|
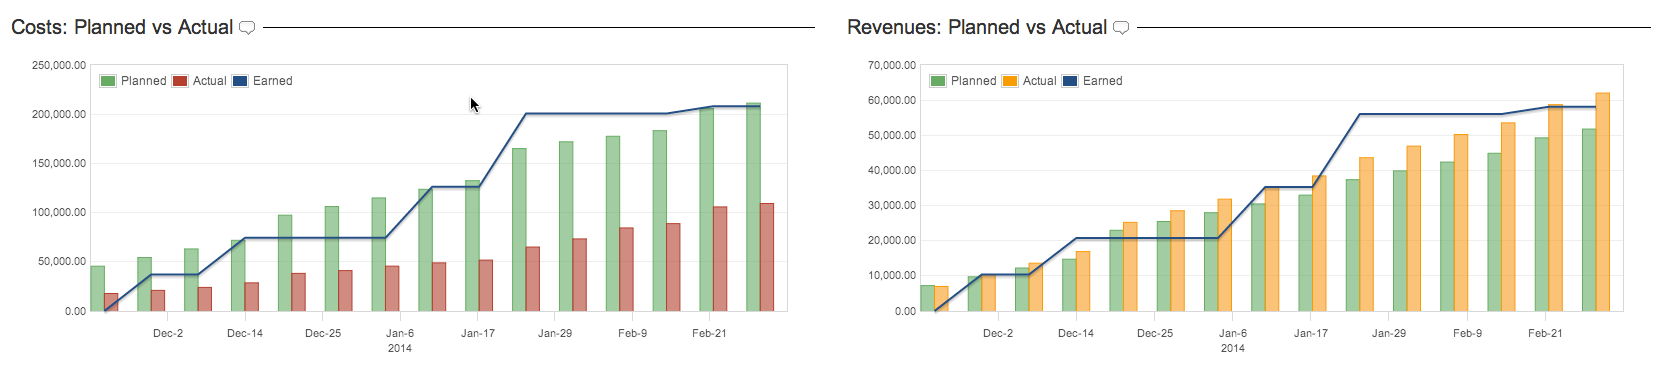
Budget vs Actual
The Overview can show one or two Budget vs Actual sections depending whether or not the Portfolio contains at least one revenues tracking Folio or not. The Budget vs Actual sections show a chart showing the evolution of the Portfolio's Planned, Actual and Earned Value (if EVM is used) over time since the earliest of its Folio's start date. Hovering the bars or curve brings up a tooltip with precise Date and Planned, Actual and possibly Earned Value.
Comments can be added, edited and deleted in the Portfolio overview the same way it can be done at the Folio level. Refer to Folio Overview documentation for all details about comments management.